Answered step by step
Verified Expert Solution
Question
1 Approved Answer
Please interpret these 3 graph. Hint: ( Don't interpret like what's the graph is showing interpret like how it will effect the both companies). Net
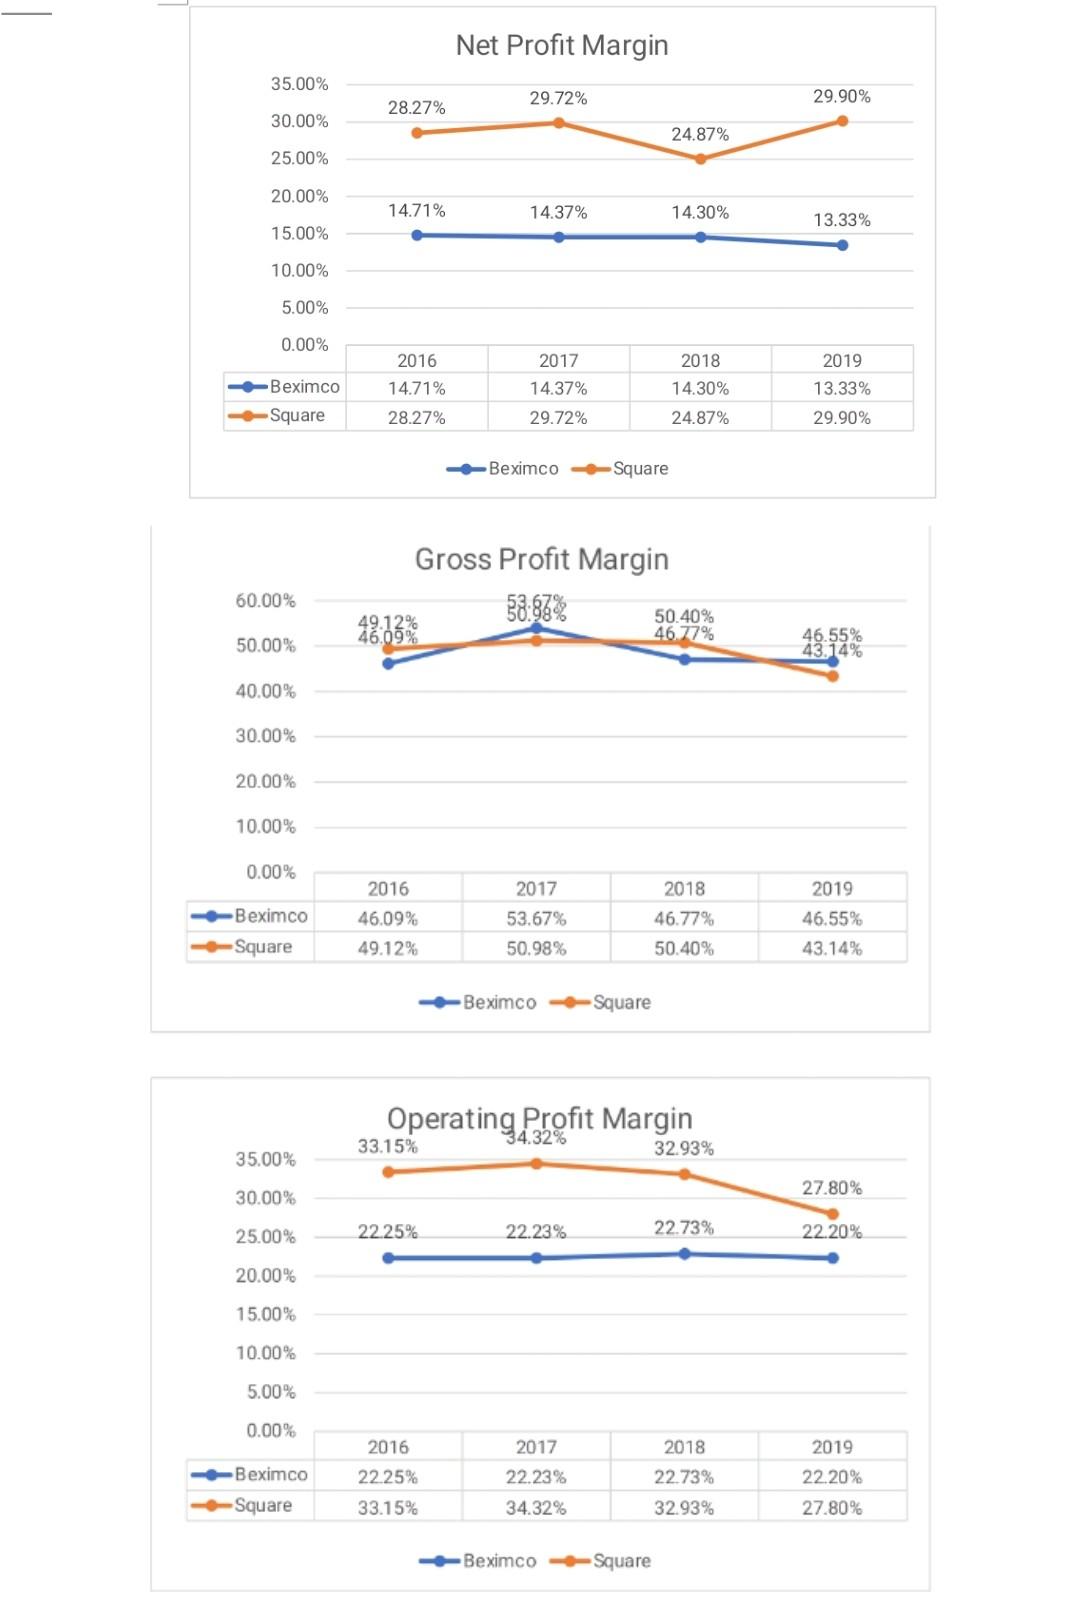
Please interpret these 3 graph.
Hint: ( Don't interpret like what's the graph is showing interpret like how it will effect the both companies).

Net Profit Margin 35.00% 29.72% 29.90% 28.27% 30.00% 24.87% 25.00% 20.00% 14.71% 14.37% 14.30% 13.33% 15.00% 10.00% 5.00% 0.00% 2016 14.71% 28.27% 2017 14.37% Beximco Square 2018 14.30% 24.87% 2019 13.33% 29.90% 29.72% Beximco -Square 60.00% Gross Profit Margin 53:38% 46,09% 49.12% 50.40% 46.77% 50.00% 46.55% 43.14% 40.00% 30.00% 20.00% 10.00% 0.00% 2018 -Beximco 2016 46.09% 49.12% 2017 53.67% 50.98% 46.77% 50.40% 2019 46.55% 43.14% Square Beximco Square Operating Profit Margin % 33.15% 32.93% 35.00% 27.80% 30.00% 25.00% 22.25% 22.23% 22.73% 22.20% 20.00% 15.00% 10.00% 5.00% 0.00% 2016 2018 2019 -Beximco Square 22.25% 33.15% 2017 22.23% 34.32% 22.73% 32.93% 22.20% 27.80% Beximco Square
Step by Step Solution
There are 3 Steps involved in it
Step: 1

Get Instant Access to Expert-Tailored Solutions
See step-by-step solutions with expert insights and AI powered tools for academic success
Step: 2

Step: 3

Ace Your Homework with AI
Get the answers you need in no time with our AI-driven, step-by-step assistance
Get Started


