

Answered step by step
Verified Expert Solution
Question
1 Approved Answer
Please just answer PART 3 . The rest is just information Assignment: Financial Statements of Business Organizations Scenario Jim Connor is the owner of Wave
Please just answer PART 3. The rest is just information
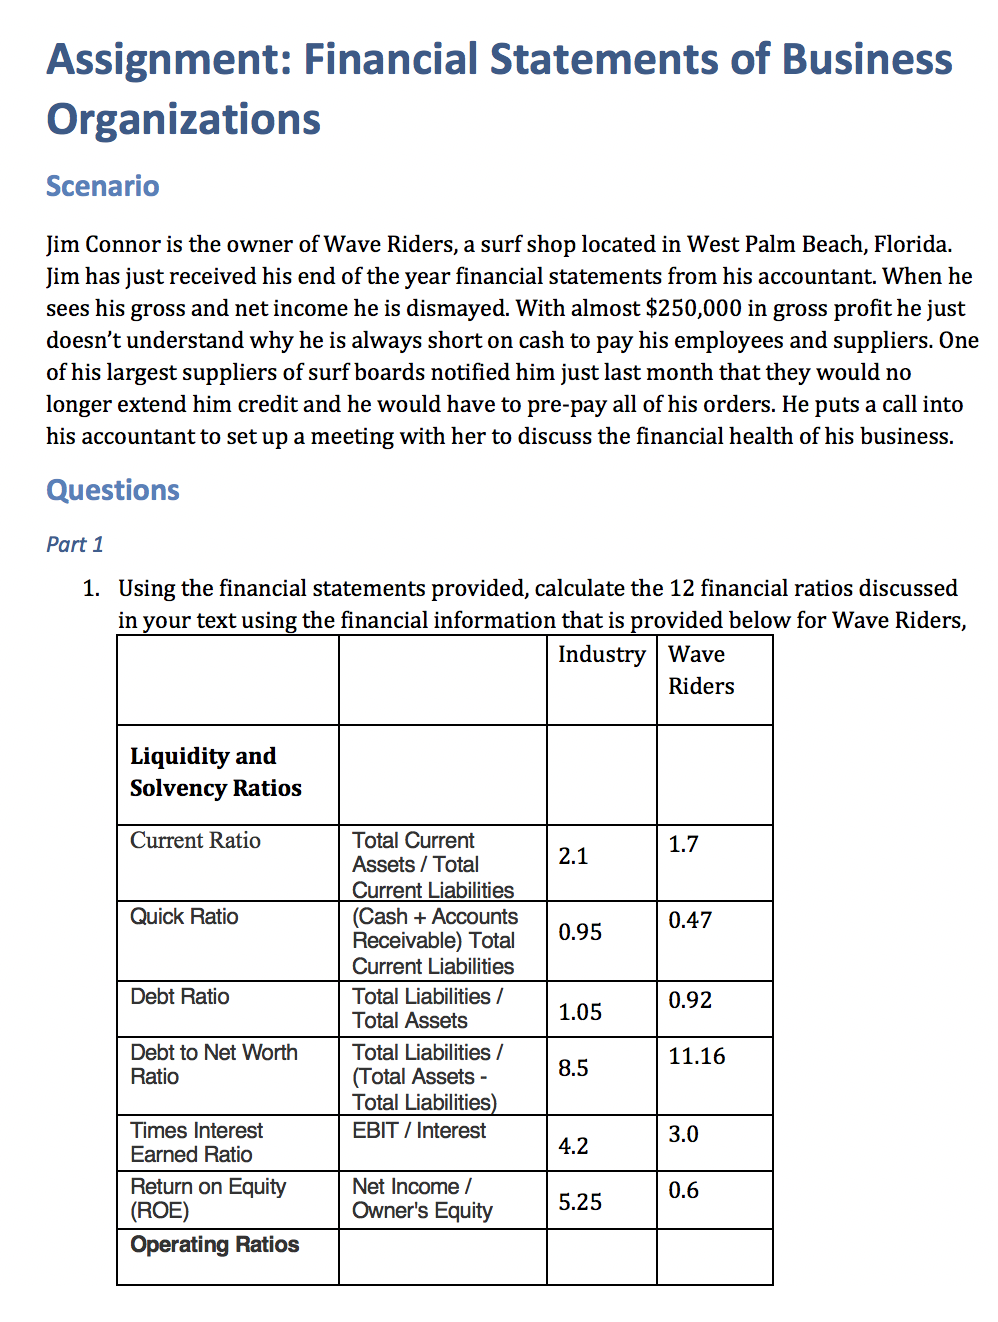
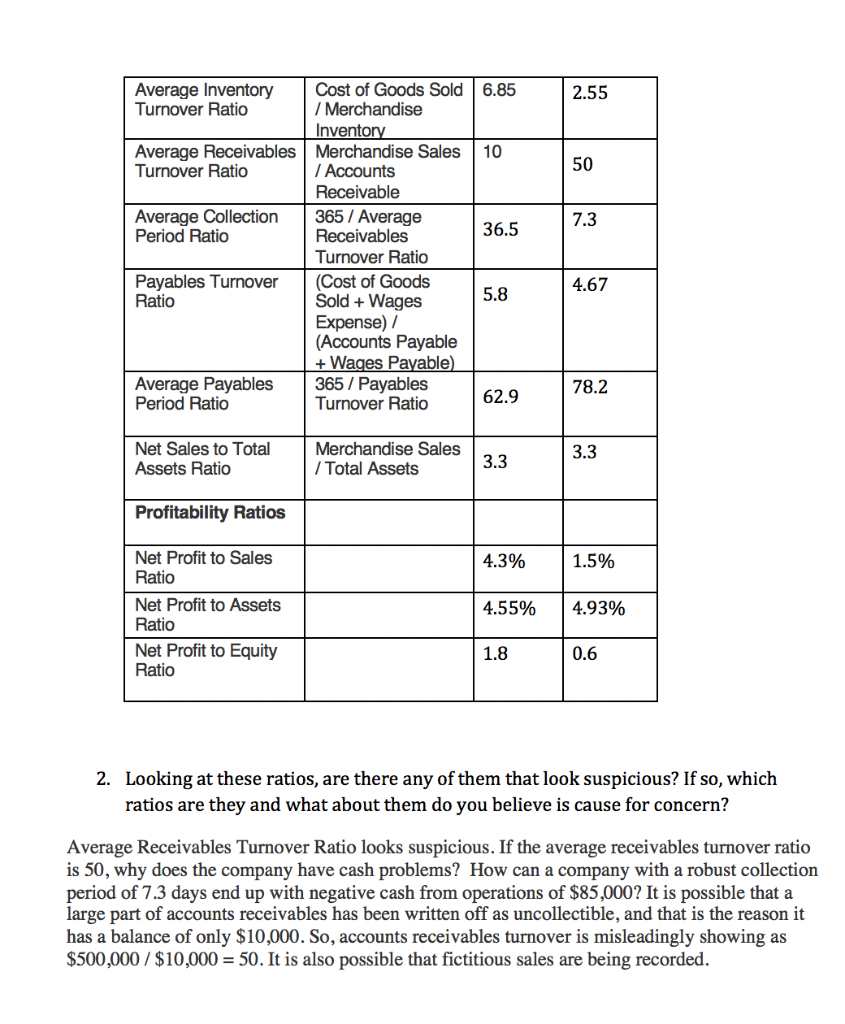
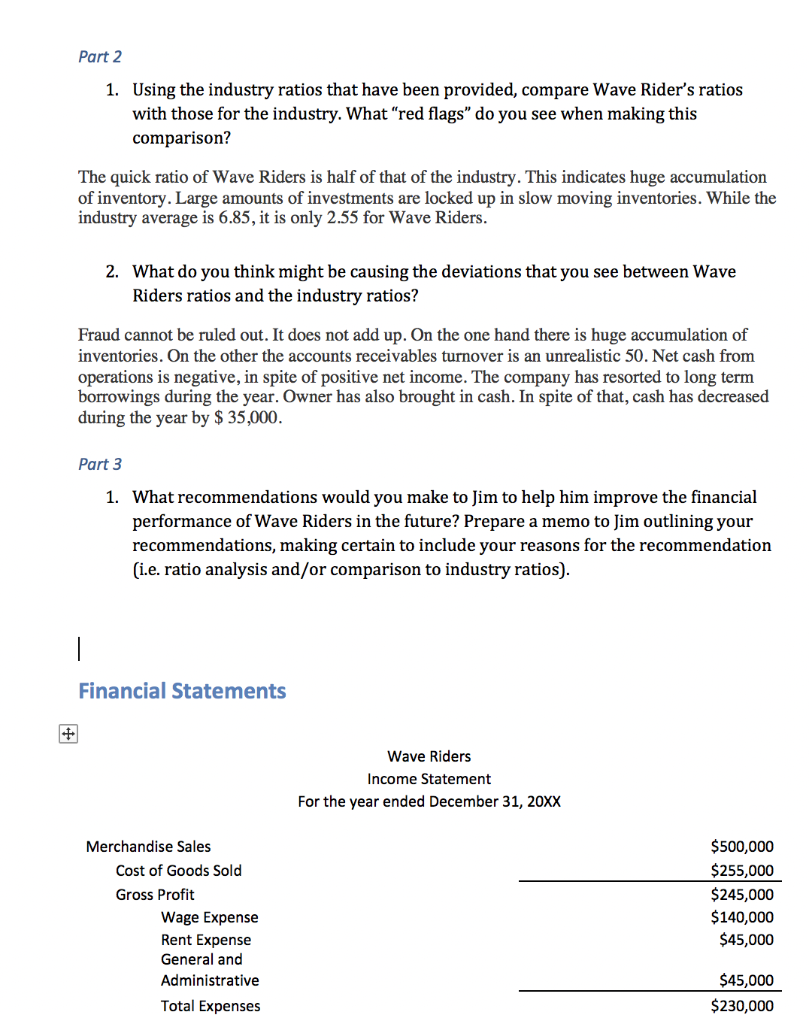
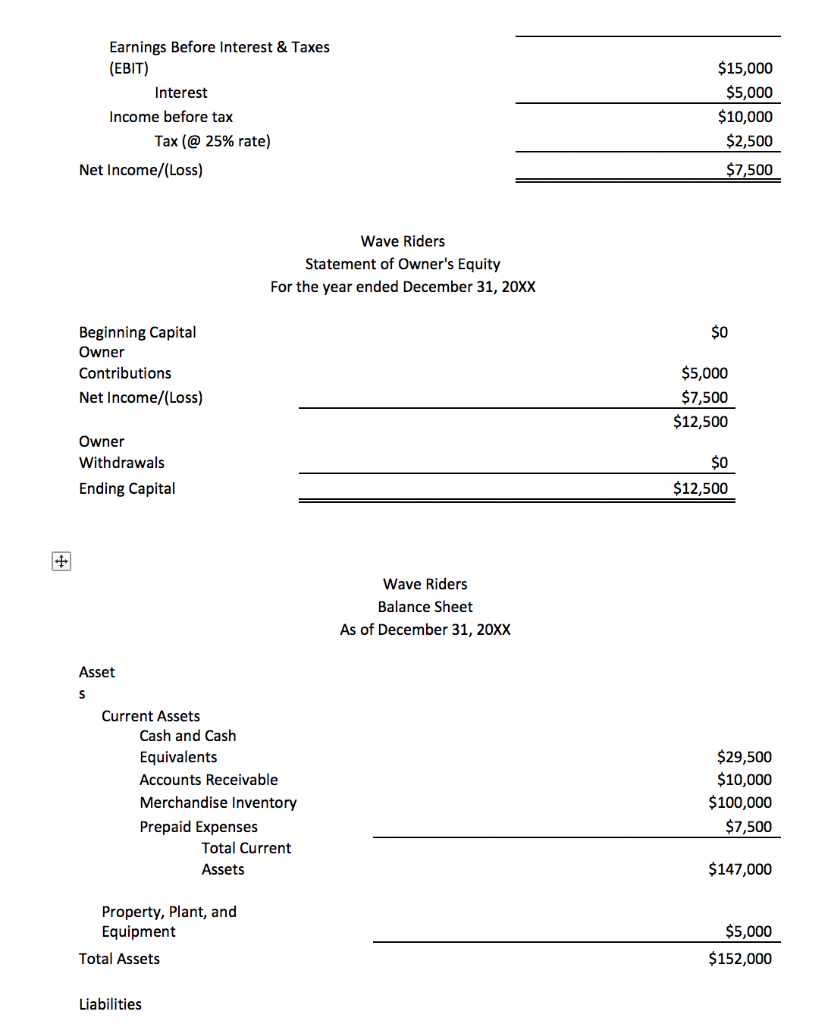
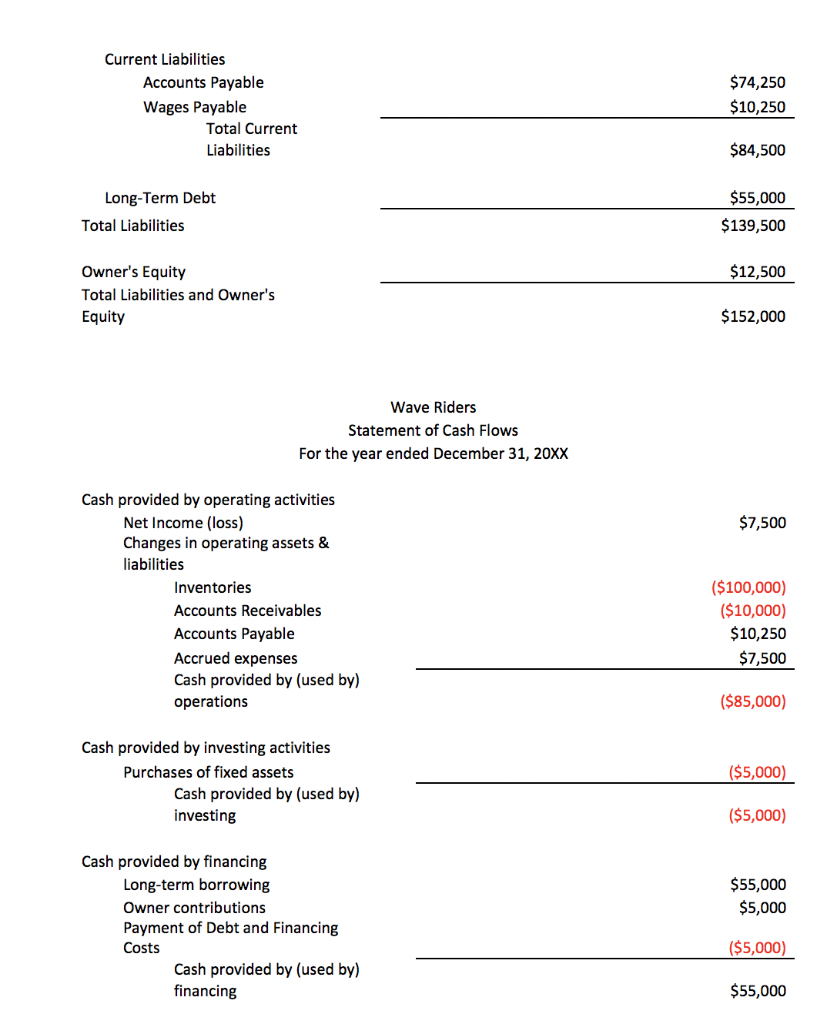
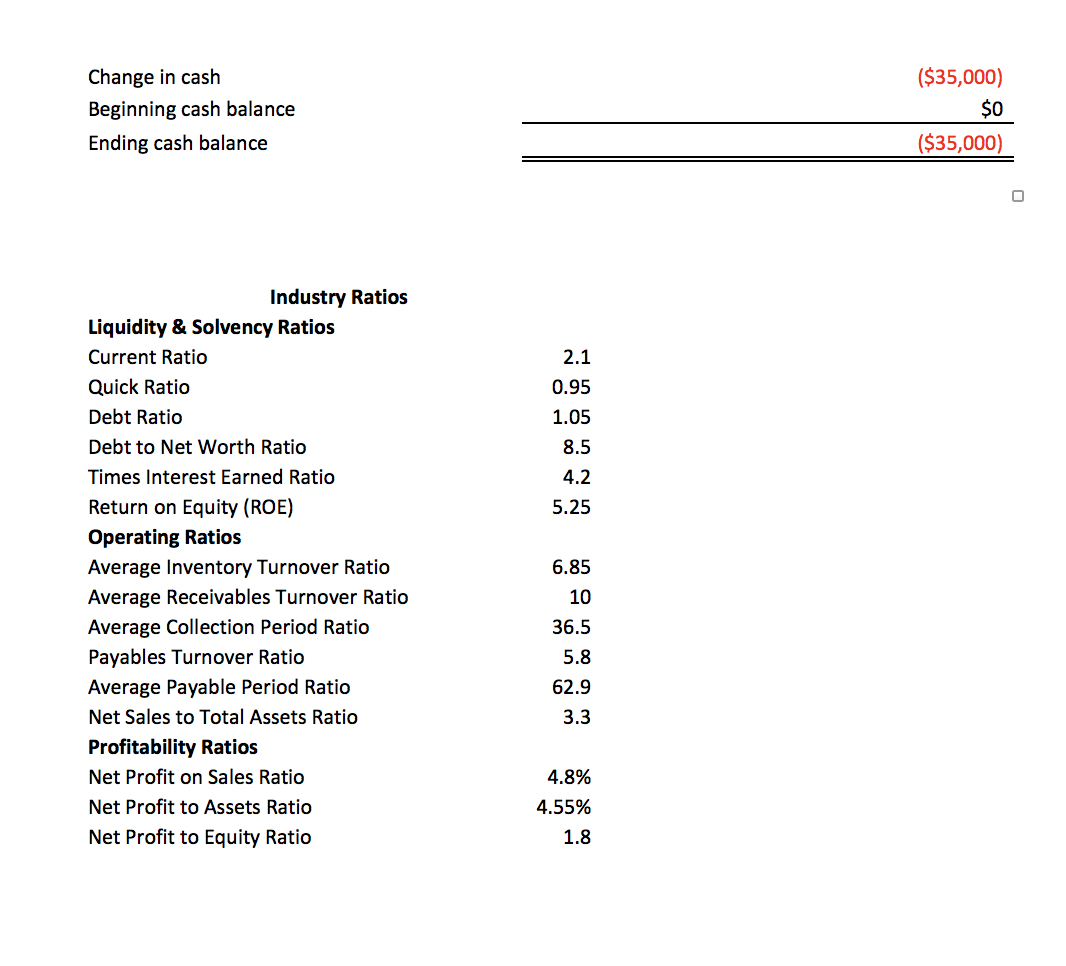
Assignment: Financial Statements of Business Organizations Scenario Jim Connor is the owner of Wave Riders, a surf shop located in West Palm Beach, Florida. Jim has just received his end of the year financial statements from his accountant. When he sees his gross and net income he is dismayed. With almost $250,000 in gross profit he just doesn't understand why he is always short on cash to pay his employees and suppliers. One of his largest suppliers of surf boards notified him just last month that they would no longer extend him credit and he would have to pre-pay all of his orders. He puts a call into his accountant to set up a meeting with her to discuss the financial health of his business. Questions Part 1 1. Using the financial statements provided, calculate the 12 financial ratios discussed in your text using the financial information that is provided below for Wave Riders, Industry Wave Riders Liquidity and Solvency Ratios Current Ratio 2.1 1.7 Quick Ratio 0.47 0.95 Debt Ratio Total Current Assets / Total Current Liabilities (Cash + Accounts Receivable) Total Current Liabilities Total Liabilities / Total Assets Total Liabilities/ (Total Assets - Total Liabilities) EBIT / Interest 0.92 1.05 11.16 Debt to Net Worth Ratio 8.5 4.2 3.0 Times Interest Earned Ratio Return on Equity (ROE) Operating Ratios 0.6 Net Income / Owner's Equity 5.25 2.55 7.3 36.5 Average Inventory Cost of Goods Sold 6.85 Turnover Ratio / Merchandise Inventory Average Receivables Merchandise Sales 10 Turnover Ratio / Accounts Receivable Average Collection 365 / Average Period Ratio Receivables Turnover Ratio Payables Turnover (Cost of Goods Ratio Sold + Wages 5.8 Expense) / (Accounts Payable + Wages Payable) Average Payables 365 / Payables Period Ratio Turnover Ratio 62.9 4.67 78.2 3.3 Net Sales to Total Assets Ratio Merchandise Sales / Total Assets 3.3 Profitability Ratios 4.3% 1.5% Net Profit to Sales Ratio Net Profit to Assets Ratio Net Profit to Equity Ratio 4.55% 4.93% 1.8 0.6 2. Looking at these ratios, are there any of them that look suspicious? If so, which ratios are they and what about them do you believe is cause for concern? Average Receivables Turnover Ratio looks suspicious. If the average receivables turnover ratio is 50, why does the company have cash problems? How can a company with a robust collection period of 7.3 days end up with negative cash from operations of $85,000? It is possible that a large part of accounts receivables has been written off as uncollectible, and that is the reason it has a balance of only $10,000. So, accounts receivables turnover is misleadingly showing as $500,000 / $10,000 = 50. It is also possible that fictitious sales are being recorded. Part 2 1. Using the industry ratios that have been provided, compare Wave Rider's ratios with those for the industry. What "red flags" do you see when making this comparison? The quick ratio of Wave Riders is half of that of the industry. This indicates huge accumulation of inventory. Large amounts of investments are locked up in slow moving inventories. While the industry average is 6.85, it is only 2.55 for Wave Riders. 2. What do you think might be causing the deviations that you see between Wave Riders ratios and the industry ratios? Fraud cannot be ruled out. It does not add up. On the one hand there is huge accumulation of inventories. On the other the accounts receivables turnover is an unrealistic 50. Net cash from operations is negative, in spite of positive net income. The company has resorted to long term borrowings during the year. Owner has also brought in cash. In spite of that, cash has decreased during the year by $ 35,000. Part 3 1. What recommendations would you make to Jim to help him improve the financial performance of Wave Riders in the future? Prepare a memo to Jim outlining your recommendations, making certain to include your reasons for the recommendation (i.e. ratio analysis and/or comparison to industry ratios). Financial Statements Wave Riders Income Statement For the year ended December 31, 20XX Merchandise Sales Cost of Goods Sold Gross Profit Wage Expense Rent Expense General and Administrative Total Expenses $500,000 $255,000 $245,000 $140,000 $45,000 $45,000 $230,000 Earnings Before Interest & Taxes (EBIT) Interest Income before tax Tax (@ 25% rate) Net Income/(Loss) $15,000 $5,000 $10,000 $2,500 $7,500 Wave Riders Statement of Owner's Equity For the year ended December 31, 20XX So Beginning Capital Owner Contributions Net Income/(Loss) $5,000 $7,500 $12,500 Owner Withdrawals Ending Capital $0 $12,500 Wave Riders Balance Sheet As of December 31, 20XX Asset Current Assets Cash and Cash Equivalents Accounts Receivable Merchandise Inventory Prepaid Expenses Total Current Assets $29,500 $10,000 $100,000 $7,500 $147,000 Property, Plant, and Equipment Total Assets $5,000 $152,000 Liabilities Current Liabilities Accounts Payable Wages Payable Total Current Liabilities $74,250 $10,250 $84,500 Long-Term Debt Total Liabilities $55,000 $139,500 $12,500 Owner's Equity Total Liabilities and Owner's Equity $152,000 Wave Riders Statement of Cash Flows For the year ended December 31, 20XX $7,500 Cash provided by operating activities Net Income (loss) Changes in operating assets & liabilities Inventories Accounts Receivables Accounts Payable Accrued expenses Cash provided by (used by) operations ($100,000) ($10,000) $10,250 $7,500 ($85,000) Cash provided by investing activities Purchases of fixed assets Cash provided by (used by) investing ($5,000) ($5,000) $55,000 $5,000 Cash provided by financing Long-term borrowing Owner contributions Payment of Debt and Financing Costs Cash provided by (used by) financing ($5,000) $55,000 Change in cash Beginning cash balance Ending cash balance ($35,000) $0 ($35,000) 2.1 0.95 1.05 8.5 4.2 5.25 Industry Ratios Liquidity & Solvency Ratios Current Ratio Quick Ratio Debt Ratio Debt to Net Worth Ratio Times Interest Earned Ratio Return on Equity (ROE) Operating Ratios Average Inventory Turnover Ratio Average Receivables Turnover Ratio Average Collection Period Ratio Payables Turnover Ratio Average Payable Period Ratio Net Sales to Total Assets Ratio Profitability Ratios Net Profit on Sales Ratio Net Profit to Assets Ratio Net Profit to Equity Ratio 6.85 10 36.5 5.8 62.9 3.3 4.8% 4.55% 1.8 Assignment: Financial Statements of Business Organizations Scenario Jim Connor is the owner of Wave Riders, a surf shop located in West Palm Beach, Florida. Jim has just received his end of the year financial statements from his accountant. When he sees his gross and net income he is dismayed. With almost $250,000 in gross profit he just doesn't understand why he is always short on cash to pay his employees and suppliers. One of his largest suppliers of surf boards notified him just last month that they would no longer extend him credit and he would have to pre-pay all of his orders. He puts a call into his accountant to set up a meeting with her to discuss the financial health of his business. Questions Part 1 1. Using the financial statements provided, calculate the 12 financial ratios discussed in your text using the financial information that is provided below for Wave Riders, Industry Wave Riders Liquidity and Solvency Ratios Current Ratio 2.1 1.7 Quick Ratio 0.47 0.95 Debt Ratio Total Current Assets / Total Current Liabilities (Cash + Accounts Receivable) Total Current Liabilities Total Liabilities / Total Assets Total Liabilities/ (Total Assets - Total Liabilities) EBIT / Interest 0.92 1.05 11.16 Debt to Net Worth Ratio 8.5 4.2 3.0 Times Interest Earned Ratio Return on Equity (ROE) Operating Ratios 0.6 Net Income / Owner's Equity 5.25 2.55 7.3 36.5 Average Inventory Cost of Goods Sold 6.85 Turnover Ratio / Merchandise Inventory Average Receivables Merchandise Sales 10 Turnover Ratio / Accounts Receivable Average Collection 365 / Average Period Ratio Receivables Turnover Ratio Payables Turnover (Cost of Goods Ratio Sold + Wages 5.8 Expense) / (Accounts Payable + Wages Payable) Average Payables 365 / Payables Period Ratio Turnover Ratio 62.9 4.67 78.2 3.3 Net Sales to Total Assets Ratio Merchandise Sales / Total Assets 3.3 Profitability Ratios 4.3% 1.5% Net Profit to Sales Ratio Net Profit to Assets Ratio Net Profit to Equity Ratio 4.55% 4.93% 1.8 0.6 2. Looking at these ratios, are there any of them that look suspicious? If so, which ratios are they and what about them do you believe is cause for concern? Average Receivables Turnover Ratio looks suspicious. If the average receivables turnover ratio is 50, why does the company have cash problems? How can a company with a robust collection period of 7.3 days end up with negative cash from operations of $85,000? It is possible that a large part of accounts receivables has been written off as uncollectible, and that is the reason it has a balance of only $10,000. So, accounts receivables turnover is misleadingly showing as $500,000 / $10,000 = 50. It is also possible that fictitious sales are being recorded. Part 2 1. Using the industry ratios that have been provided, compare Wave Rider's ratios with those for the industry. What "red flags" do you see when making this comparison? The quick ratio of Wave Riders is half of that of the industry. This indicates huge accumulation of inventory. Large amounts of investments are locked up in slow moving inventories. While the industry average is 6.85, it is only 2.55 for Wave Riders. 2. What do you think might be causing the deviations that you see between Wave Riders ratios and the industry ratios? Fraud cannot be ruled out. It does not add up. On the one hand there is huge accumulation of inventories. On the other the accounts receivables turnover is an unrealistic 50. Net cash from operations is negative, in spite of positive net income. The company has resorted to long term borrowings during the year. Owner has also brought in cash. In spite of that, cash has decreased during the year by $ 35,000. Part 3 1. What recommendations would you make to Jim to help him improve the financial performance of Wave Riders in the future? Prepare a memo to Jim outlining your recommendations, making certain to include your reasons for the recommendation (i.e. ratio analysis and/or comparison to industry ratios). Financial Statements Wave Riders Income Statement For the year ended December 31, 20XX Merchandise Sales Cost of Goods Sold Gross Profit Wage Expense Rent Expense General and Administrative Total Expenses $500,000 $255,000 $245,000 $140,000 $45,000 $45,000 $230,000 Earnings Before Interest & Taxes (EBIT) Interest Income before tax Tax (@ 25% rate) Net Income/(Loss) $15,000 $5,000 $10,000 $2,500 $7,500 Wave Riders Statement of Owner's Equity For the year ended December 31, 20XX So Beginning Capital Owner Contributions Net Income/(Loss) $5,000 $7,500 $12,500 Owner Withdrawals Ending Capital $0 $12,500 Wave Riders Balance Sheet As of December 31, 20XX Asset Current Assets Cash and Cash Equivalents Accounts Receivable Merchandise Inventory Prepaid Expenses Total Current Assets $29,500 $10,000 $100,000 $7,500 $147,000 Property, Plant, and Equipment Total Assets $5,000 $152,000 Liabilities Current Liabilities Accounts Payable Wages Payable Total Current Liabilities $74,250 $10,250 $84,500 Long-Term Debt Total Liabilities $55,000 $139,500 $12,500 Owner's Equity Total Liabilities and Owner's Equity $152,000 Wave Riders Statement of Cash Flows For the year ended December 31, 20XX $7,500 Cash provided by operating activities Net Income (loss) Changes in operating assets & liabilities Inventories Accounts Receivables Accounts Payable Accrued expenses Cash provided by (used by) operations ($100,000) ($10,000) $10,250 $7,500 ($85,000) Cash provided by investing activities Purchases of fixed assets Cash provided by (used by) investing ($5,000) ($5,000) $55,000 $5,000 Cash provided by financing Long-term borrowing Owner contributions Payment of Debt and Financing Costs Cash provided by (used by) financing ($5,000) $55,000 Change in cash Beginning cash balance Ending cash balance ($35,000) $0 ($35,000) 2.1 0.95 1.05 8.5 4.2 5.25 Industry Ratios Liquidity & Solvency Ratios Current Ratio Quick Ratio Debt Ratio Debt to Net Worth Ratio Times Interest Earned Ratio Return on Equity (ROE) Operating Ratios Average Inventory Turnover Ratio Average Receivables Turnover Ratio Average Collection Period Ratio Payables Turnover Ratio Average Payable Period Ratio Net Sales to Total Assets Ratio Profitability Ratios Net Profit on Sales Ratio Net Profit to Assets Ratio Net Profit to Equity Ratio 6.85 10 36.5 5.8 62.9 3.3 4.8% 4.55% 1.8Step by Step Solution
There are 3 Steps involved in it
Step: 1

Get Instant Access to Expert-Tailored Solutions
See step-by-step solutions with expert insights and AI powered tools for academic success
Step: 2

Step: 3
Ace Your Homework with AI
Get the answers you need in no time with our AI-driven, step-by-step assistance
Get Started
Auditing Philosophy And Technique
Authors: John William Cook
1st Edition
039520660X, 978-0395206607