

Answered step by step
Verified Expert Solution
Question
1 Approved Answer
Please just answer the chart from the last picture. Will rate Analytics Exercise 20-3 (Algo) Bigtosweaters.com is a new company started last year by two
Please just answer the chart from the last picture. Will rate 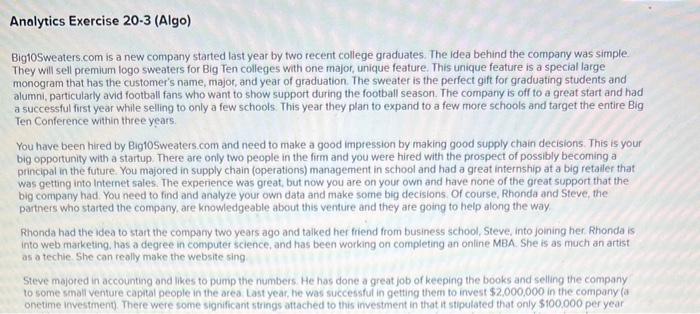
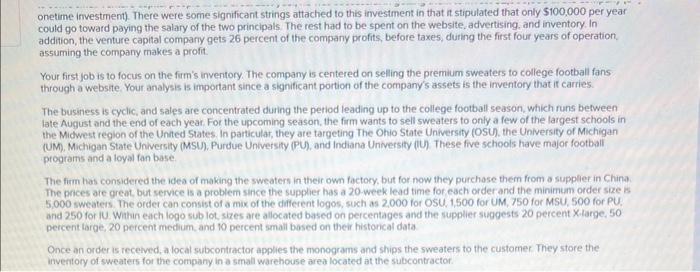
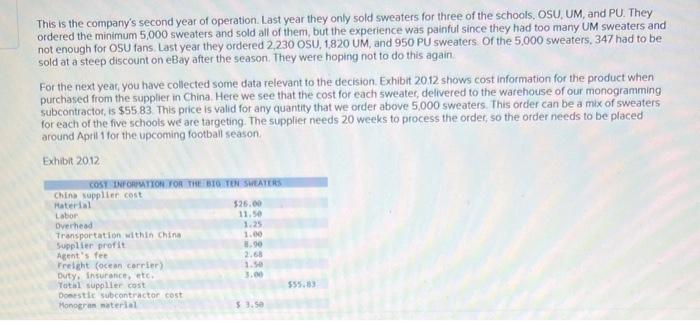
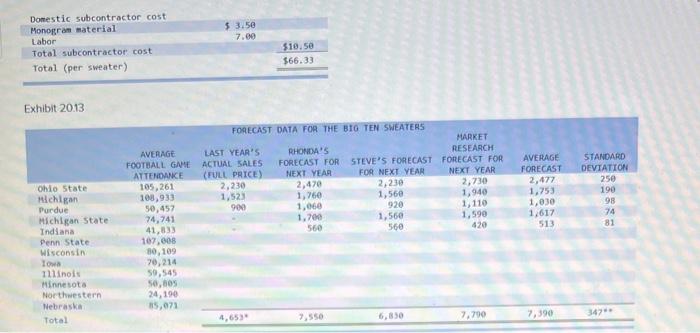
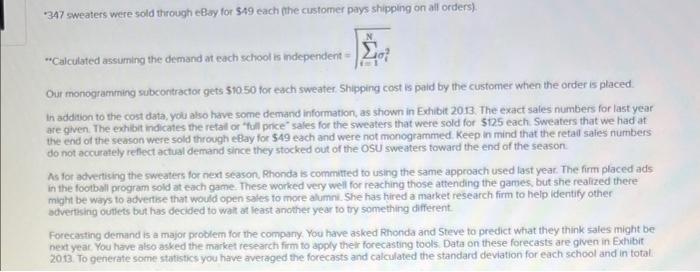
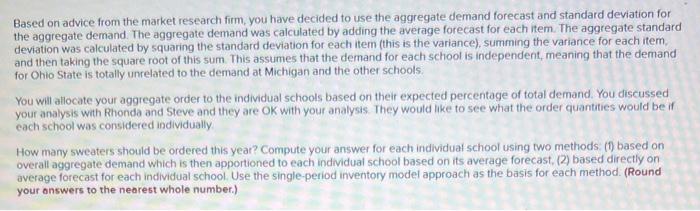
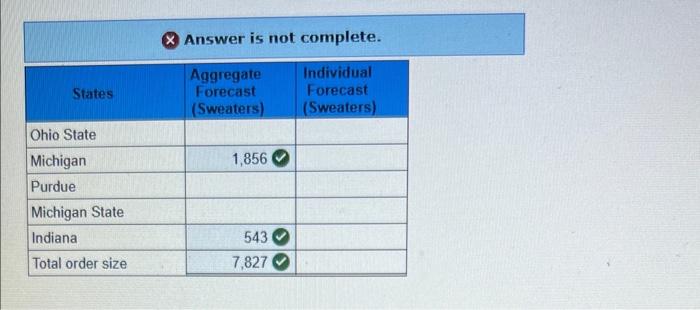
Analytics Exercise 20-3 (Algo) Bigtosweaters.com is a new company started last year by two recent college graduates. The idea behind the company was simple. They will sell premium logo sweaters for Big Ten colleges with one major, unique feature. This unique feature is a special large monogram that has the customer's name, major, and year of graduation. The sweater is the perfect gitt for graduating students and alumni, particularly avid football fans who want to show support during the football season. The company is off to a great start and had a successful first year while selling to only a few schools. This year they plan to expand to a few more schools and target the entire Big Ten Conference within three years. You have been hired by Big10sweaters.com and need to make a good impression by making good supply chain decisions. This is your big opportunity with a startup. There are only two people in the firm and you were hired with the prospect of possibly becoming a principal in the future. You majored in supply chain (operations) management in school and had a great internship at a big retailer that was getting into Internet sales. The experience was great, but now you are on your own and have none of the great support that the big company had. You need to find and analyze your own data and make some big decisions. Of course, Rhonda and Steve, the partners who started the company, are knowledgeable about this venture and they are going to help along the way Rhonda had the idea to start the compary two years ago and talked her friend from business school, Steve, into joining her. Rhonda is into web marketing. has a degree in computer science, and has been working on completing an online MBA. She is as much an artist. as a techie. She can really make the website sing Steve majored in accounting and likes to pump the numbers. He has done a great job of keeping the books and selling the company to some smali venture capital people in the area. Last yeat, he was successful in getting them to invest $2.000,000 in the company (a onetime investment. There were some significant strings attached to this investment in that it stipulated that only $100.000 per year onetime irvestment). There were some significant strings attached to this imvestment in that it stipulated that only $100,000 per year could go toward paying the salary of the two principals. The rest had to be spent on the website, advertising. and inventory. In addition, the venture capital comparty gets 26 percent of the company profits, before taxes, during the first four years of operation, assuming the company makes a profit. Your first job is to focus on the fum's inventory. The company is centered on selling the premium sweaters to college footbali fans through a website. Your analysis is important since a significant portion of the company's assets is the inventory that it carries. The business is cyclic, and sales are concentrated during the period leading up to the college football season, which runs between late August and the end of each year. For the upcoming season, the firm wants to sell sweaters to only a few of the largest schools in the Midwest region of the Unted States. In particular, they are targeting The Ohio State University (OSU), the University of Michigan (UM), Michigan State University (MSU). Purdue University (PU), and Indiana University (IU) These five schools have major football programs and a loyal fan base. The firm has considered the idea of making the sweaters in their own factory, but for now they purchase them from a supplier in China The pnces are great, but service is a problem since the supplier has a 20 -week lead time for each order and the minimum order size s : 5,000 sweateis. The order can consist of a mix of the different logos, such as 2,000 for OSU, 1,500 for UM, 750 for MSU, 500 for PU and 250 for 10 . Within eich logo sub lot, sizes are allocated based on percentages and the supplier suggests 20 percent iarge, 50 percent targe, 20 percent medium, and 10 percent small bosed on their histonical data Once an order is received, a local subcontractor applies the monograms and ships the sweaters to the customer. They store the inventory of sweaters for the company in a small warehouse area located at the subcontractor. This is the company's second year of operation. Last year they only sold sweaters for three of the schools, OSU, UM, and PU. They ordered the minimum 5,000 sweaters and sold all of them, but the experience was painful since they had too many UM sweaters and not enough for OSU fans. Last year they ordered 2,230 OSU, 1,820 UM, and 950PU sweaters. Of the 5,000 sweaters, 347 had to be sold at a steep discount on eBay after the season. They were hoping not to do this again. For the next year, you have collected some data relevant to the decision. Exhibit 2012 shows cost information for the product when purchased from the supplier in China. Here we see that the cost for each sweater, delivered to the warehouse of our monogramming subcontractor, is $55.83. This price is valid for any quantity that we order above 5,000 sweaters. This order can be a mix of sweaters for each of the five schools we are targeting. The supplier needs 20 weeks to process the order, so the order needs to be placed around Apill 1 for the upcoming football season. Exhibit 20.12 Exhibit 20.13 "Calculated assuming the demand at each school is independent =1=1N12 Our monogramming subcontractor gets 51050 for each sweater. Shipping cost is paid by the customer when the order is placed. In addition to the cost data, you also have some demand information, as shown in Exthbit 2013 . The exact sales numbers for last year are given. The extibit indicates the retal or "full price" sales for the sweaters that were sold for $125 each. Sweaters that we had at the end of the season were sold through eflay for 549 each and were not monogrammed. Keep in mind that the retail saies numbers do not accurately reflect actual demand since they stocked out of the OSU sweaters toward the end of the season, As for adventising the sweaters for next season. Rhonda is committed to using the same approach used last year. The firm placed ads in the football program sold at each game. These worked very well for reaching those attending the games, but she realized there might be ways to advertise that would open sales to more alumni. She has hired a matket research firm to help identify other ativertising outlets bet has decided to walt at least ancther year to try something different. Forecasting demand is a major problem for the company. You have asked Rhonda and Steve to predict what they think sales might be next year You have atso asked the market research firm to apply their forecasting tools. Data on these forecasts are given in Exhibit. 2013 . To generate some statistics you have averaged the forecasts and calculated the standard deviation for each school and in total. Based on advice from the market research firm, you have decided to use the aggregate demand forecast and standard deviation for the aggregate demand. The aggregate demand was calculated by adding the average forecast for each item. The aggregate standard deviation was calculated by squaring the standard deviation for each item (this is the variance), summing the variance for each item. and then taking the square root of this sum. This assumes that the demand for each school is independent, meaning that the demand for Ohio State is totally unrelated to the demand at Michigan and the other schools. You will allocate your aggregate order to the individual schools based on their expected percentage of total demand. You discussed your analysis with Rhonda and Steve and they are OK with your analysis. They would like to see what the order quantities would be if each school was considered individually. How many sweaters should be ordered this year? Compute your answer for each individual school using two methods: (1) based on overall aggregate demand which is then apportioned to each individual school based on its average forecast, (2) based directly on. average forecast for each individual school. Use the single-period inventory model approach as the basis for each method. (Round your answers to the nearest whole number.) X Answer is not complete. Analytics Exercise 20-3 (Algo) Bigtosweaters.com is a new company started last year by two recent college graduates. The idea behind the company was simple. They will sell premium logo sweaters for Big Ten colleges with one major, unique feature. This unique feature is a special large monogram that has the customer's name, major, and year of graduation. The sweater is the perfect gitt for graduating students and alumni, particularly avid football fans who want to show support during the football season. The company is off to a great start and had a successful first year while selling to only a few schools. This year they plan to expand to a few more schools and target the entire Big Ten Conference within three years. You have been hired by Big10sweaters.com and need to make a good impression by making good supply chain decisions. This is your big opportunity with a startup. There are only two people in the firm and you were hired with the prospect of possibly becoming a principal in the future. You majored in supply chain (operations) management in school and had a great internship at a big retailer that was getting into Internet sales. The experience was great, but now you are on your own and have none of the great support that the big company had. You need to find and analyze your own data and make some big decisions. Of course, Rhonda and Steve, the partners who started the company, are knowledgeable about this venture and they are going to help along the way Rhonda had the idea to start the compary two years ago and talked her friend from business school, Steve, into joining her. Rhonda is into web marketing. has a degree in computer science, and has been working on completing an online MBA. She is as much an artist. as a techie. She can really make the website sing Steve majored in accounting and likes to pump the numbers. He has done a great job of keeping the books and selling the company to some smali venture capital people in the area. Last yeat, he was successful in getting them to invest $2.000,000 in the company (a onetime investment. There were some significant strings attached to this investment in that it stipulated that only $100.000 per year onetime irvestment). There were some significant strings attached to this imvestment in that it stipulated that only $100,000 per year could go toward paying the salary of the two principals. The rest had to be spent on the website, advertising. and inventory. In addition, the venture capital comparty gets 26 percent of the company profits, before taxes, during the first four years of operation, assuming the company makes a profit. Your first job is to focus on the fum's inventory. The company is centered on selling the premium sweaters to college footbali fans through a website. Your analysis is important since a significant portion of the company's assets is the inventory that it carries. The business is cyclic, and sales are concentrated during the period leading up to the college football season, which runs between late August and the end of each year. For the upcoming season, the firm wants to sell sweaters to only a few of the largest schools in the Midwest region of the Unted States. In particular, they are targeting The Ohio State University (OSU), the University of Michigan (UM), Michigan State University (MSU). Purdue University (PU), and Indiana University (IU) These five schools have major football programs and a loyal fan base. The firm has considered the idea of making the sweaters in their own factory, but for now they purchase them from a supplier in China The pnces are great, but service is a problem since the supplier has a 20 -week lead time for each order and the minimum order size s : 5,000 sweateis. The order can consist of a mix of the different logos, such as 2,000 for OSU, 1,500 for UM, 750 for MSU, 500 for PU and 250 for 10 . Within eich logo sub lot, sizes are allocated based on percentages and the supplier suggests 20 percent iarge, 50 percent targe, 20 percent medium, and 10 percent small bosed on their histonical data Once an order is received, a local subcontractor applies the monograms and ships the sweaters to the customer. They store the inventory of sweaters for the company in a small warehouse area located at the subcontractor. This is the company's second year of operation. Last year they only sold sweaters for three of the schools, OSU, UM, and PU. They ordered the minimum 5,000 sweaters and sold all of them, but the experience was painful since they had too many UM sweaters and not enough for OSU fans. Last year they ordered 2,230 OSU, 1,820 UM, and 950PU sweaters. Of the 5,000 sweaters, 347 had to be sold at a steep discount on eBay after the season. They were hoping not to do this again. For the next year, you have collected some data relevant to the decision. Exhibit 2012 shows cost information for the product when purchased from the supplier in China. Here we see that the cost for each sweater, delivered to the warehouse of our monogramming subcontractor, is $55.83. This price is valid for any quantity that we order above 5,000 sweaters. This order can be a mix of sweaters for each of the five schools we are targeting. The supplier needs 20 weeks to process the order, so the order needs to be placed around Apill 1 for the upcoming football season. Exhibit 20.12 Exhibit 20.13 "Calculated assuming the demand at each school is independent =1=1N12 Our monogramming subcontractor gets 51050 for each sweater. Shipping cost is paid by the customer when the order is placed. In addition to the cost data, you also have some demand information, as shown in Exthbit 2013 . The exact sales numbers for last year are given. The extibit indicates the retal or "full price" sales for the sweaters that were sold for $125 each. Sweaters that we had at the end of the season were sold through eflay for 549 each and were not monogrammed. Keep in mind that the retail saies numbers do not accurately reflect actual demand since they stocked out of the OSU sweaters toward the end of the season, As for adventising the sweaters for next season. Rhonda is committed to using the same approach used last year. The firm placed ads in the football program sold at each game. These worked very well for reaching those attending the games, but she realized there might be ways to advertise that would open sales to more alumni. She has hired a matket research firm to help identify other ativertising outlets bet has decided to walt at least ancther year to try something different. Forecasting demand is a major problem for the company. You have asked Rhonda and Steve to predict what they think sales might be next year You have atso asked the market research firm to apply their forecasting tools. Data on these forecasts are given in Exhibit. 2013 . To generate some statistics you have averaged the forecasts and calculated the standard deviation for each school and in total. Based on advice from the market research firm, you have decided to use the aggregate demand forecast and standard deviation for the aggregate demand. The aggregate demand was calculated by adding the average forecast for each item. The aggregate standard deviation was calculated by squaring the standard deviation for each item (this is the variance), summing the variance for each item. and then taking the square root of this sum. This assumes that the demand for each school is independent, meaning that the demand for Ohio State is totally unrelated to the demand at Michigan and the other schools. You will allocate your aggregate order to the individual schools based on their expected percentage of total demand. You discussed your analysis with Rhonda and Steve and they are OK with your analysis. They would like to see what the order quantities would be if each school was considered individually. How many sweaters should be ordered this year? Compute your answer for each individual school using two methods: (1) based on overall aggregate demand which is then apportioned to each individual school based on its average forecast, (2) based directly on. average forecast for each individual school. Use the single-period inventory model approach as the basis for each method. (Round your answers to the nearest whole number.) X Answer is not complete Step by Step Solution
There are 3 Steps involved in it
Step: 1

Get Instant Access to Expert-Tailored Solutions
See step-by-step solutions with expert insights and AI powered tools for academic success
Step: 2

Step: 3
Ace Your Homework with AI
Get the answers you need in no time with our AI-driven, step-by-step assistance
Get Started
Managerial Accounting
Authors: Stacey Whitecotton, Robert Libby, Fred Phillips
5th Edition
1264467206, 978-1264467204