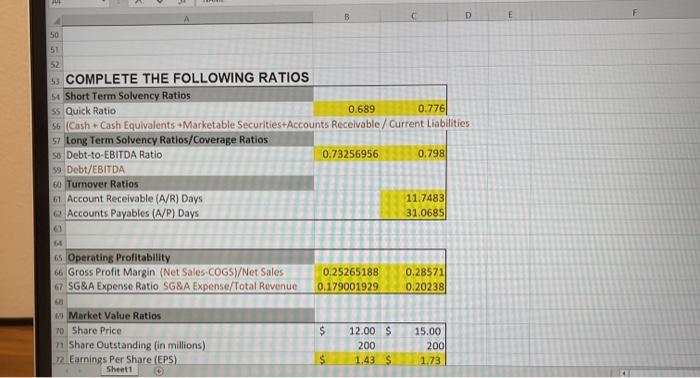
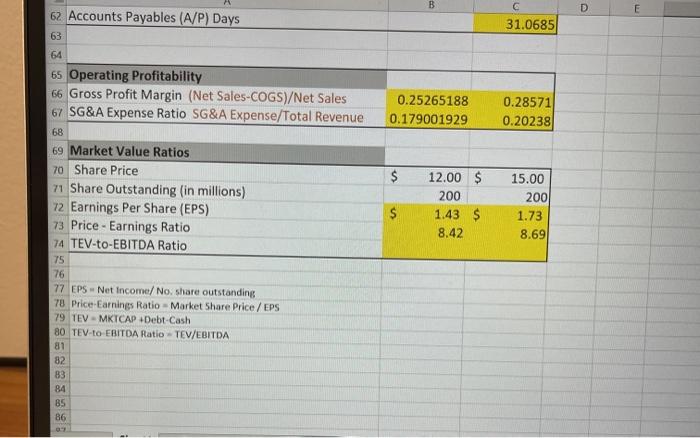
please just focus on this
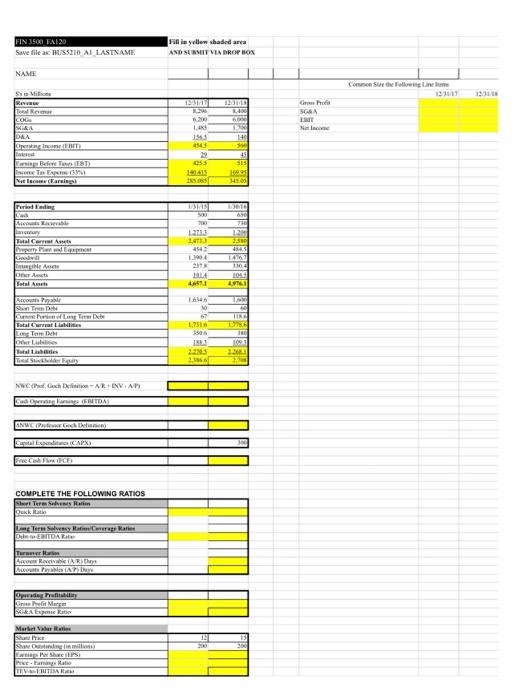
I need TEV-to-EBITDA Ratio please
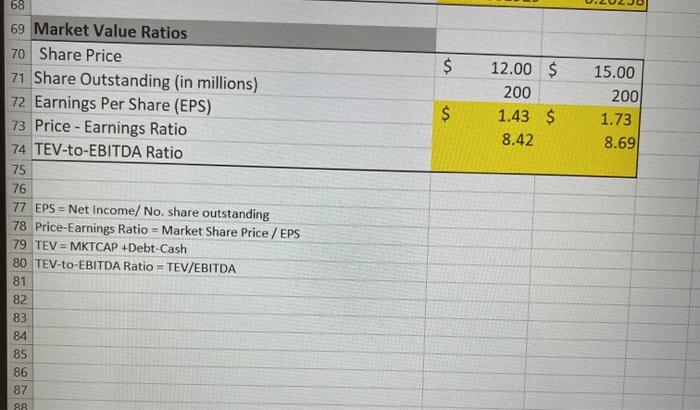
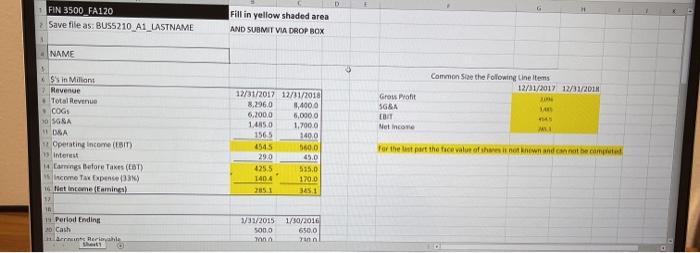
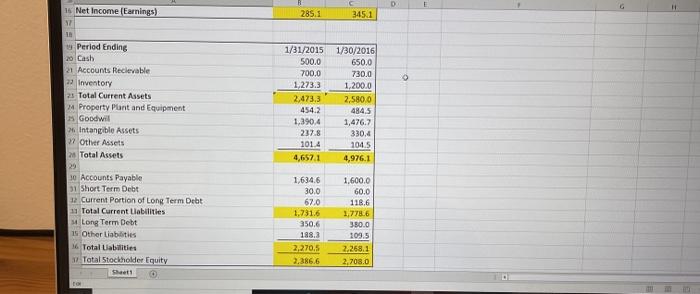
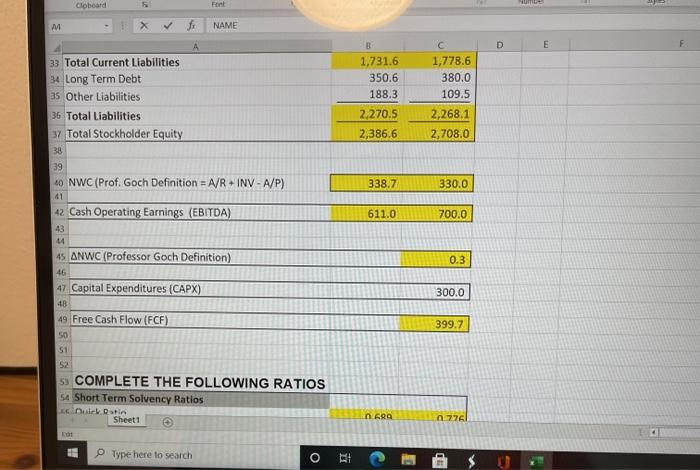
FIN 3500 FAI20 Save file as US5210 AI LASTNAME Fill in yellow shaded area AND SUSHIT VIA DROP BOX NAME Como Se Following Line me 13 Si Miss 12 GRA CON TR ICE RA ban OHIT 143 14 su 45 SES La BALITAT come To EU! Notarial 1415 Prading www 1223 1433 630 TIE 12 2310 44 Total Curl Party Pal Equipment Ante Arts 14 110.4 10 ALI Ayah Site CLTD Total Currat Lee TIRE 67 1.751 350 23 2.1 NWCCP Gach Definition AREVAN Budem LTDA ANG CAPPX FCF COMPLETE THE FOLLOWING RATIOS Turun Sandalen pukkate La Torre Sony Hall DETARE Tur Arome APIA Une Petit Mures BAR Muret er SO Shares ta TIVITA $ 68 69 Market Value Ratios 70 Share Price 71 Share Outstanding (in millions) 72 Earnings Per Share (EPS) 73 Price - Earnings Ratio 74 TEV-to-EBITDA Ratio 75 12.00 $ 200 1.43 $ 8.42 $ 15.00 200 1.73 8.69 76 77 EPS = Net Income/ No. share outstanding 78 Price-Earnings Ratio - Market Share Price / EPS 79 TEV = MKTCAP +Debt-Cash 80 TEV-to-EBITDA Ratio = TEV/EBITDA 81 82 83 84 85 86 87 88 FIN 3500 FA120 Save file as: BUS5210_AI LASTNAME Fill in yellow shaded area AND SUBMIT VA DROP BOX 3 INAME Common See the following line items 12/31/2017 12/31/2011 Sin Million Revenge Total Revenue COGI SORA Gross Profit SGA Net Incore 45 M OSA 12/31/2017 12/01/2018 8,296,0 3,4000 6,200,0 5,0000 1485.0 1.700.0 1565 140.0 4545 560.0 290 49.0 4255 5150 1404 170.0 2051 1 Operating income (EBIT) interest Earrings Before Taxes (ET) Income Tax Expense) fint income (Eamine) 1 For the last part the face value of this new and cannot became 14 Perlod Ending 10 Cash Harris Rere 1/31/2015 5000 mon 1/30/2016 650.0 rinn 285.1 345.1 is Net Income (Earnings) 17 18 Period Ending 20 Cash 21 Accounts Recievable 22 Inventory 25 Total Current Assets Property Plant and Equipment Goodwill Intangible Assets 37 Otive Assets 2 Total Assets 29 30 Accounts Payable 31 Short Term Debt 12 Current Portion of Long Term Debt Total Current Liabilities Long Term Debt 15 Other Liabilities 16 Total Liabilities Total Stockholder Equity that 1/31/2015 500.0 700.0 1.273.3 2,473,3 454.2 1.390.4 2378 1014 4,657.1 1/30/2016 650,0 730.0 1,200.0 2.580.0 4845 1,476.7 330,4 104.5 4,976.1 1,6346 30.0 67.0 1.731.6 350.6 188.a 2,270.5 2.386.6 1.600.0 60.0 118.6 2.778.6 380.0 109.5 2.268.1 2.708.0 TO Clobeard M NAME D E 1,731.6 350.6 188.3 1,778.6 380.0 109.5 33 Total Current Liabilities 34 Long Term Debt 35 Other Liabilities 36 Total Liabilities 37 Total Stockholder Equity 38 2,270.5 2,386.6 2,268.1 2,708.0 338.7 330.0 39 40 NWC (Prof. Goch Definition = A/R INV - A/P) 41 42 Cash Operating Earnings (EBITDA) 43 611.0 700.0 14 0.3 45 ANWC (Professor Goch Definition) 46 47 Capital Expenditures (CAPX) 300.0 48 399.7 49 Free Cash Flow (FCF) 50 51 52 s COMPLETE THE FOLLOWING RATIOS 54 Short Term Solvency Ratios Due Datin Sheet1 n 68 n 7761 Type here to search E GE D E 50 51 52 COMPLETE THE FOLLOWING RATIOS 1 Short Term Solvency Ratios 55 Quick Ratio 0.689 0.776 S6 (Cash Cash Equivalents +Marketable Securities+Accounts Receivable / Current Liabilities 5 Long Term Solvency Ratios/Coverage Ratios sa Debt-to-EBITDA Ratio 0.73256956 0.798 59 Debt/EBITDA 60 Turnover Ratios G Account Receivable (A/R) Days 11.7483 Accounts Payables (A/P) Days 31.0685 0.25265188 0.179001929 0.28571 0.20238 Operating profitability 66 Gross Profit Margin (Net Sales COGS)/Net Sales SG&A Expense Ratio SG&A Expense/Total Revenue 60 Market Value Ratios 10 Share Price n Share Outstanding (in millions) n. Earnings Per Share (EPS) Sheet1 $ 12.00 S 200 1.43 $ 15.00 2001 1.73 $ B D E 31.0685 0.25265188 0.179001929 0.28571 0.20238 $ 62 Accounts Payables (A/P) Days 63 64 65 Operating Profitability 66 Gross Profit Margin (Net Sales-COGS)/Net Sales 67 SG&A Expense Ratio SG&A Expense/Total Revenue 68 69 Market Value Ratios 70 Share Price 71 Share Outstanding (in millions) 72 Earnings Per Share (EPS) 73 Price - Earnings Ratio 74 TEV-to-EBITDA Ratio 75 76 77 EPS. Net Income/ No share outstanding 78 Price-Earnings Ratio - Market Share Price/ EPS 79 TEV - MKTCAP Debt-Cash 80 TEV-to EBITDA Ratio - TEV/EBITDA 81 82 83 84 BS 86 $ 12.00 $ 200 1.43 $ 8.42 15.00 200 1.73 8.69
