Question: PLEASE JUST I WANT TO SOLVE TABLE 3 WITH RESULT AND CONCLUSION Optimization of Sea water/ brackish water/ permeate water using IMS Software Introduction IMS
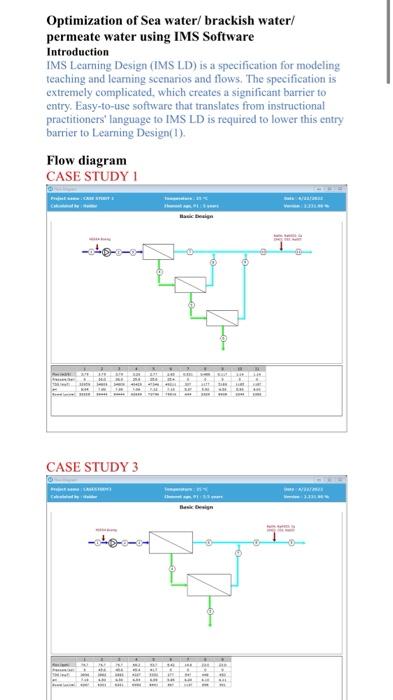
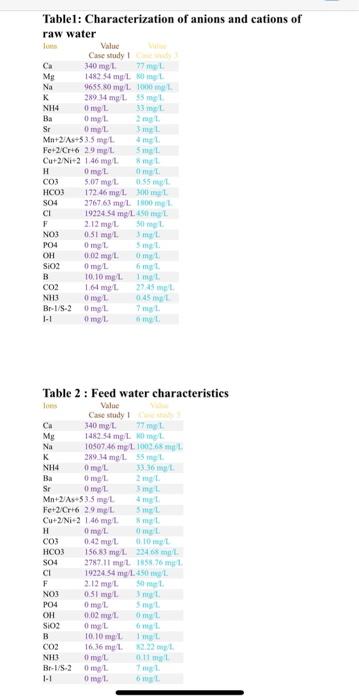
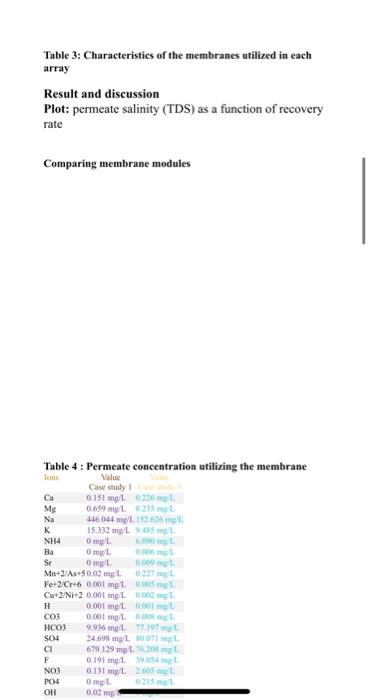
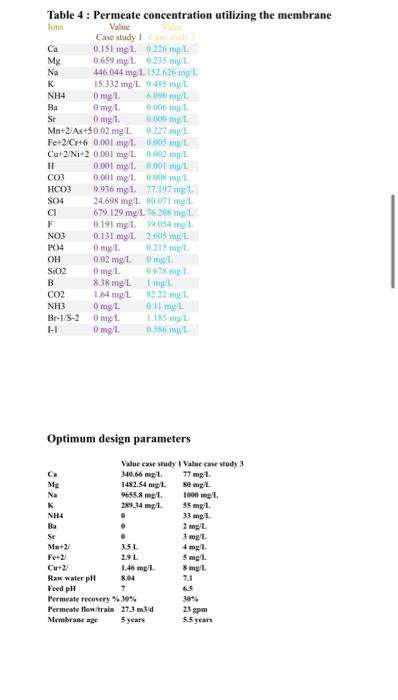
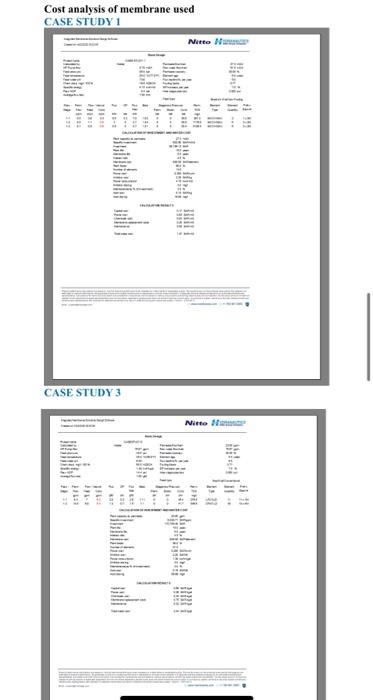
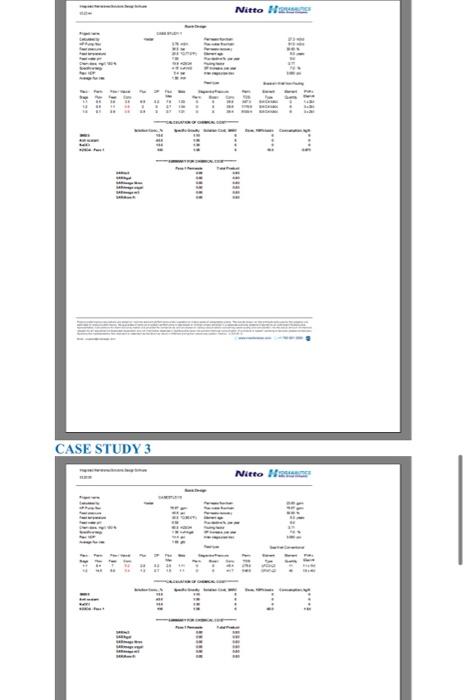
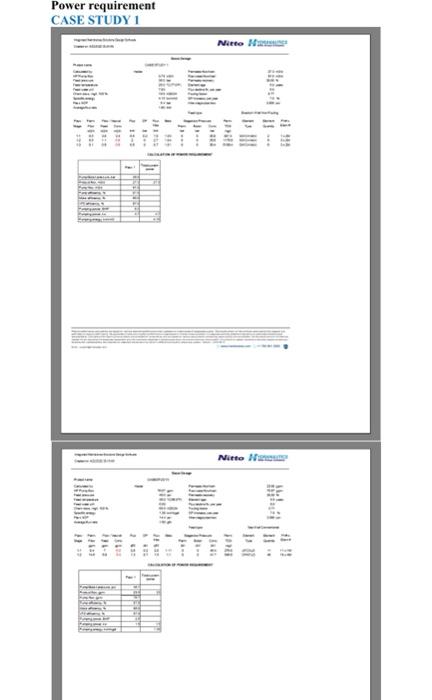
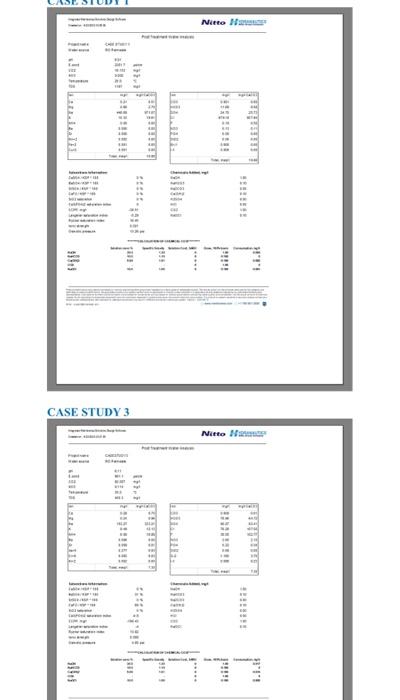
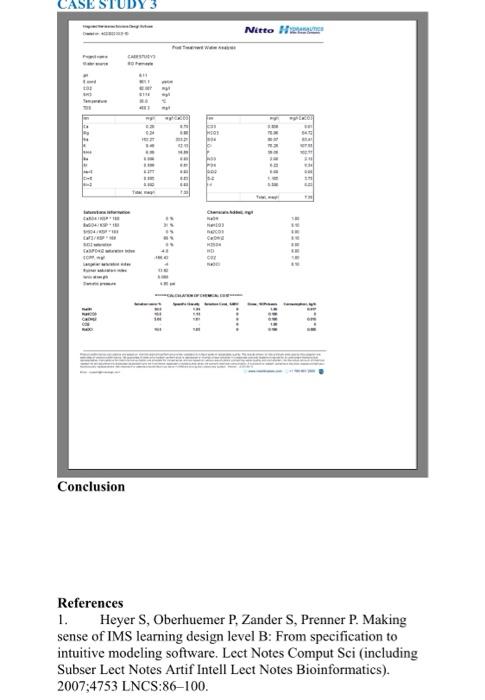
Optimization of Sea water/ brackish water/ permeate water using IMS Software Introduction IMS Learning Design (IMS LD) is a specification for modeling teaching and leaming scenarios and flows. The specification is extremely complicated, which creates a significant barrier to entry. Easy-to-use software that translates from instructional practitioners' language to IMS LD is required to lower this entry barrier to Learning Design(1). Flow diagram CASE STUDY 1 HER 41 CASE STUDY 3 ESSE E-111 111 11 Tablel: Characterization of anions and cations of raw water Value Case study Ca 340 mg 77 met Mg 1482 54 mg/L OL Na 9655.20 mg L 100ML K 289 34 mg 15 ml NH4 OL 33 met Ba Oml Sr Oml met Mn+2/As+53.5 ml Fe+2/Cr6 20 ml 5 Cu+2/Ni-2 146 mg L. H OmpL 5.07 mg 1. HCO3 172.46 molt SO4 276763 mg/L 100 ml CI 19224 84 mg/1.451 tum F 2.12 mg met 0.51 ml PO4 Omg L OH 0.02 ml met SiO2 OmpL B 10,10 mt. mt CO2 1.64 met 22 NH3 0 mg 0:43 Br-1/S- 20ml I-1 Oml NOS Table 2 : Feed water characteristics Value Case study CA 40 ng My 1482 54mL NOML Na 10507.46 mg 1.100268 ml K 289.34 mg 1.55 met NH4 OmpL 33:16 Ba Omgt Sr OmpL 3ml Mn+2A-535 mg/l Fe+2/Cr6 29 met Set Cu+2/Ni-2 146 mg . H 0 mg Om 003 0.42 mg HCO3 156.83 mg 1.2346 SO4 2787. 11 ml 1858.76 mil CI 19224.4 mg 1.450 F 2.12 m. samt NO3 0.31 mg met PO4 OH 0.02 ml my SIO2 0mL B 10,10 mg It CO2 16.36 mg NH3 Oml 11 m Br-17S-2 Oml 1-1 Oml Table 3: Characteristics of the membranes utilized in each array Result and discussion Plot: permeate salinity (TDS) as a function of recovery rate Comparing membrane modules Table 4 : Permeate concentration utilizing the membrane lone Value Case study Ca 0.151 mg/L 0.25 ml Mg 0.659 ml 15ml Na 446,044 ngL 8 GD H. K 15.332 mg L 9.5 mL NH4 Omg/l. GO Ba Oml 0006 mol Sr Omg/L 0.009 Mn+2/As+500 ml 0227 Fe-2/Cr+6 0.001 ml 015 met Cut2/Ni-2 0.001 mg L 0000 H 0.001 mg 0.00 CO3 0,001 ml 008 99 H1 | | SO4 24.698mL SOL 679,129 mg 1:20 F 0.191 mgl. 054 mL NO3 0.131 mpl 200ml P04 Omg 0315 OH HCO3 0.00m Table 4 : Permeate concentration utilizing the membrane lon Value Case study 1 Ca 0.151 mg/L ) 16 H I. Mg 0.659 mg/L 0.235 mL Na 446,044 mg/L. 152.26 met K 15.332 mgL 945 mL NH4 Omg/L 6.00 Ba Omg 0.006 Sr | tig L 0.009 Mn+2/As+50.02 mg L 0.227 Fe+2/Cr+6 0.001 mg 0005 Cut2/Ni+2 0.001 mg 1.000 ml H 0,01 mg/L 0.00 | 19/L CO3 0.001 mg 0.00 mL HCO3 9.936 mg 1.77197 met SO4 24.698 mg L 071 ml CI 679.129 mL 76.20 L F 0,191 trig | | | | | | NO3 0.131 ng l 3 13 thg L. PO4 OmgL 0215 OH 0.02 ml Oml SiO2 Omg t. 067 B 838 mg 1 mail CO2 64 mg 12.2 met Omg L 0.11 ml Br-1/8-2 Omet LIL I-1 Omgl. 0:55ml NH3 NHA Optimum design parameters Value case study 1 Value case study 3 Ca M, b mt/. 7 PL ME 1482.54 mg. so mgl. Na 9655.8 ma l 1000 ml K 18 4 35 mg 31 mp Ba 2. . 3 m 1. Mat2 251 4 mg. Fe+ 2.91 5 mg/L Cu-2 1.46 mg/L Raw waterpl 8.04 7.1 Feed pH 65 Permeate recovery%30% 30% Permeate flowtrain 27.3 m.id 23 pm Membrane ape 5 years 55 years 3 mgt. Cost analysis of membrane used CASE STUDY 1 Nitto Na !! TER 17 tot CASE STUDY 3 Ninto a 11133 11 21: 12 Nitto Hace CASE STUDY 3 Nitto HS 2 . 1 Power requirement CASE STUDY 1 Nitto N 11 31 11 17 THI Nitto Non STE Ei mer 22 Nitto N IIIIII + CASE STUDY 3 Nitto N 13 111 Nirto H os Can Net Conclusion References 1. Heyer S, Oberhuemer P. Zander S, Prenner P. Making sense of IMS learning design level B: From specification to intuitive modeling software. Lect Notes Comput Sci (including Subser Lect Notes Artif Intell Lect Notes Bioinformatics). 2007;4753 LNCS:86-100. Optimization of Sea water/ brackish water/ permeate water using IMS Software Introduction IMS Learning Design (IMS LD) is a specification for modeling teaching and leaming scenarios and flows. The specification is extremely complicated, which creates a significant barrier to entry. Easy-to-use software that translates from instructional practitioners' language to IMS LD is required to lower this entry barrier to Learning Design(1). Flow diagram CASE STUDY 1 HER 41 CASE STUDY 3 ESSE E-111 111 11 Tablel: Characterization of anions and cations of raw water Value Case study Ca 340 mg 77 met Mg 1482 54 mg/L OL Na 9655.20 mg L 100ML K 289 34 mg 15 ml NH4 OL 33 met Ba Oml Sr Oml met Mn+2/As+53.5 ml Fe+2/Cr6 20 ml 5 Cu+2/Ni-2 146 mg L. H OmpL 5.07 mg 1. HCO3 172.46 molt SO4 276763 mg/L 100 ml CI 19224 84 mg/1.451 tum F 2.12 mg met 0.51 ml PO4 Omg L OH 0.02 ml met SiO2 OmpL B 10,10 mt. mt CO2 1.64 met 22 NH3 0 mg 0:43 Br-1/S- 20ml I-1 Oml NOS Table 2 : Feed water characteristics Value Case study CA 40 ng My 1482 54mL NOML Na 10507.46 mg 1.100268 ml K 289.34 mg 1.55 met NH4 OmpL 33:16 Ba Omgt Sr OmpL 3ml Mn+2A-535 mg/l Fe+2/Cr6 29 met Set Cu+2/Ni-2 146 mg . H 0 mg Om 003 0.42 mg HCO3 156.83 mg 1.2346 SO4 2787. 11 ml 1858.76 mil CI 19224.4 mg 1.450 F 2.12 m. samt NO3 0.31 mg met PO4 OH 0.02 ml my SIO2 0mL B 10,10 mg It CO2 16.36 mg NH3 Oml 11 m Br-17S-2 Oml 1-1 Oml Table 3: Characteristics of the membranes utilized in each array Result and discussion Plot: permeate salinity (TDS) as a function of recovery rate Comparing membrane modules Table 4 : Permeate concentration utilizing the membrane lone Value Case study Ca 0.151 mg/L 0.25 ml Mg 0.659 ml 15ml Na 446,044 ngL 8 GD H. K 15.332 mg L 9.5 mL NH4 Omg/l. GO Ba Oml 0006 mol Sr Omg/L 0.009 Mn+2/As+500 ml 0227 Fe-2/Cr+6 0.001 ml 015 met Cut2/Ni-2 0.001 mg L 0000 H 0.001 mg 0.00 CO3 0,001 ml 008 99 H1 | | SO4 24.698mL SOL 679,129 mg 1:20 F 0.191 mgl. 054 mL NO3 0.131 mpl 200ml P04 Omg 0315 OH HCO3 0.00m Table 4 : Permeate concentration utilizing the membrane lon Value Case study 1 Ca 0.151 mg/L ) 16 H I. Mg 0.659 mg/L 0.235 mL Na 446,044 mg/L. 152.26 met K 15.332 mgL 945 mL NH4 Omg/L 6.00 Ba Omg 0.006 Sr | tig L 0.009 Mn+2/As+50.02 mg L 0.227 Fe+2/Cr+6 0.001 mg 0005 Cut2/Ni+2 0.001 mg 1.000 ml H 0,01 mg/L 0.00 | 19/L CO3 0.001 mg 0.00 mL HCO3 9.936 mg 1.77197 met SO4 24.698 mg L 071 ml CI 679.129 mL 76.20 L F 0,191 trig | | | | | | NO3 0.131 ng l 3 13 thg L. PO4 OmgL 0215 OH 0.02 ml Oml SiO2 Omg t. 067 B 838 mg 1 mail CO2 64 mg 12.2 met Omg L 0.11 ml Br-1/8-2 Omet LIL I-1 Omgl. 0:55ml NH3 NHA Optimum design parameters Value case study 1 Value case study 3 Ca M, b mt/. 7 PL ME 1482.54 mg. so mgl. Na 9655.8 ma l 1000 ml K 18 4 35 mg 31 mp Ba 2. . 3 m 1. Mat2 251 4 mg. Fe+ 2.91 5 mg/L Cu-2 1.46 mg/L Raw waterpl 8.04 7.1 Feed pH 65 Permeate recovery%30% 30% Permeate flowtrain 27.3 m.id 23 pm Membrane ape 5 years 55 years 3 mgt. Cost analysis of membrane used CASE STUDY 1 Nitto Na !! TER 17 tot CASE STUDY 3 Ninto a 11133 11 21: 12 Nitto Hace CASE STUDY 3 Nitto HS 2 . 1 Power requirement CASE STUDY 1 Nitto N 11 31 11 17 THI Nitto Non STE Ei mer 22 Nitto N IIIIII + CASE STUDY 3 Nitto N 13 111 Nirto H os Can Net Conclusion References 1. Heyer S, Oberhuemer P. Zander S, Prenner P. Making sense of IMS learning design level B: From specification to intuitive modeling software. Lect Notes Comput Sci (including Subser Lect Notes Artif Intell Lect Notes Bioinformatics). 2007;4753 LNCS:86-100
Step by Step Solution
There are 3 Steps involved in it

Get step-by-step solutions from verified subject matter experts


