

Question
PLEASE LIST FORMULAS The figure below contains a combination chart to display different kinds of information on different scales for multiple data series. A column
PLEASE LIST FORMULAS
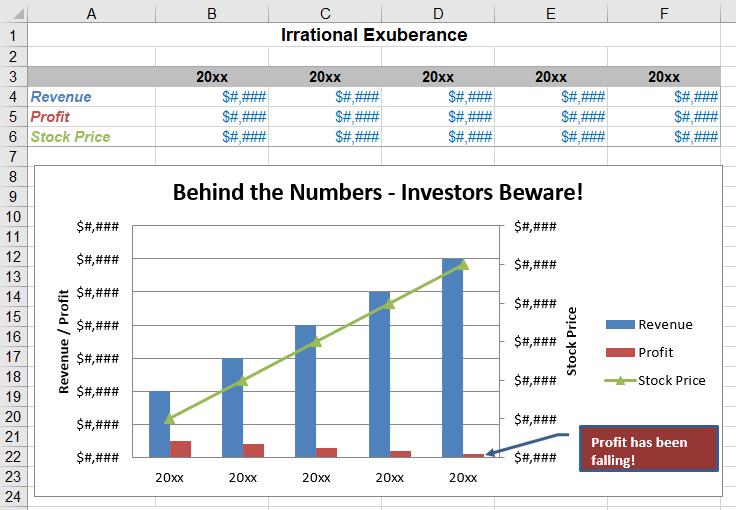
The figure below contains a combination chart to display different kinds of information on different scales for multiple data series. A column chart is specified for the revenue and profits, while a line chart is used for the stock price. Two different scales are necessary because the magnitudes of the numbers differ significantly.
1. Open the provided file Irrational_Exuberance.txt and transfer the data into an Excel worksheet (named Irrational_Exuberance).
data:
,2013,2014,2015,2016,2017 Revenue,40000000,60000000,80000000,100000000,120000000 Profit,10000000,8000000,6000000,4000000,2000000 Stock Price,10,20,30,40,50
2. Create a custom chart type: a line-column with 2 y-axes. HINT: Some current versions of Excel do not have a "line-column on 2 axes" chart type. But you can create a column chart, then select the Stock Price (in the legend), right-click and choose "Format Data Series" then in the Series Options, choose to "Plot Series On: Secondary Axis." You should also right-click on Stock Price and choose "Change Series Chart Type" to make that series a line chart.
3. Modify the worksheet table of data and the completed chart to look like the image shown below. (Please use the years provided in the data file you were provided.)
4. Adjust the Page Layout so that your work would print in landscape orientation, and centered horizontally on the page. HINT: To center your printout on a page, click Page Layout, Margins, Custom Margins, (or Page Layout, Page Setup, Margins) then Center on page (check boxes for Horizontally, Vertically). Note: Do not select the chart before trying to set these options.
5. Create a custom header and footer for your worksheet. The custom header should contain your name, your course, and your instructor's name. The custom footer should contain the name of the file in which the worksheet resides, the current date (no matter what day the file is opened), and the current time (no matter what time the file is opened)..
6. Use one of the Shapes (from the Insert, Shapes menu) to point out how low the Profit has dropped in the final year depicted in the chart.
7. Include a link back to documentation sheet as shown in the screenshot.
Step by Step Solution
There are 3 Steps involved in it
Step: 1

Get Instant Access to Expert-Tailored Solutions
See step-by-step solutions with expert insights and AI powered tools for academic success
Step: 2

Step: 3
Ace Your Homework with AI
Get the answers you need in no time with our AI-driven, step-by-step assistance
Get Started
Technology And Finance Challenges For Financial Markets Business Strategies And Policy Makers
Authors: Morten Balling, Frank Lierman, Andy Mullineux
1st Edition
041529827X, 978-0415298278