 Please list the functions used in the process of making this pivot table. Thank you
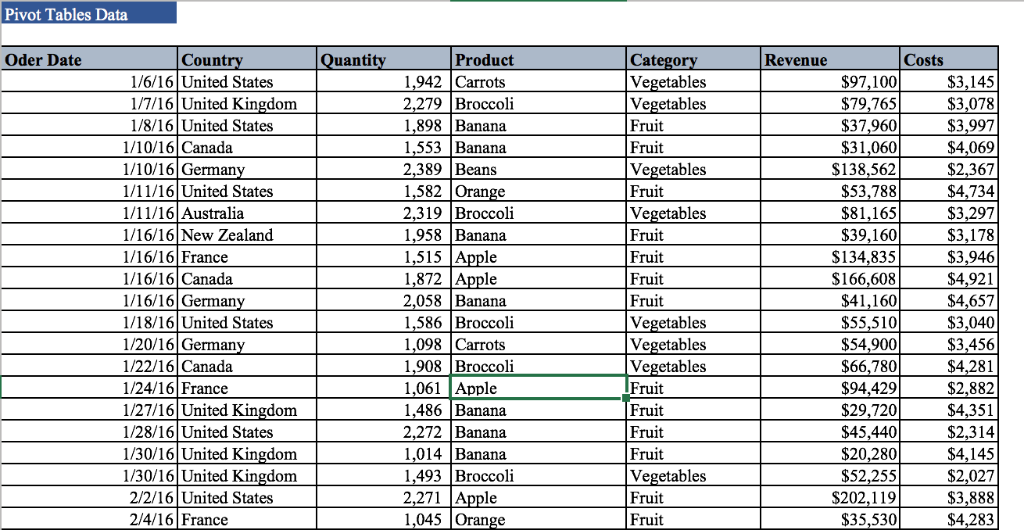
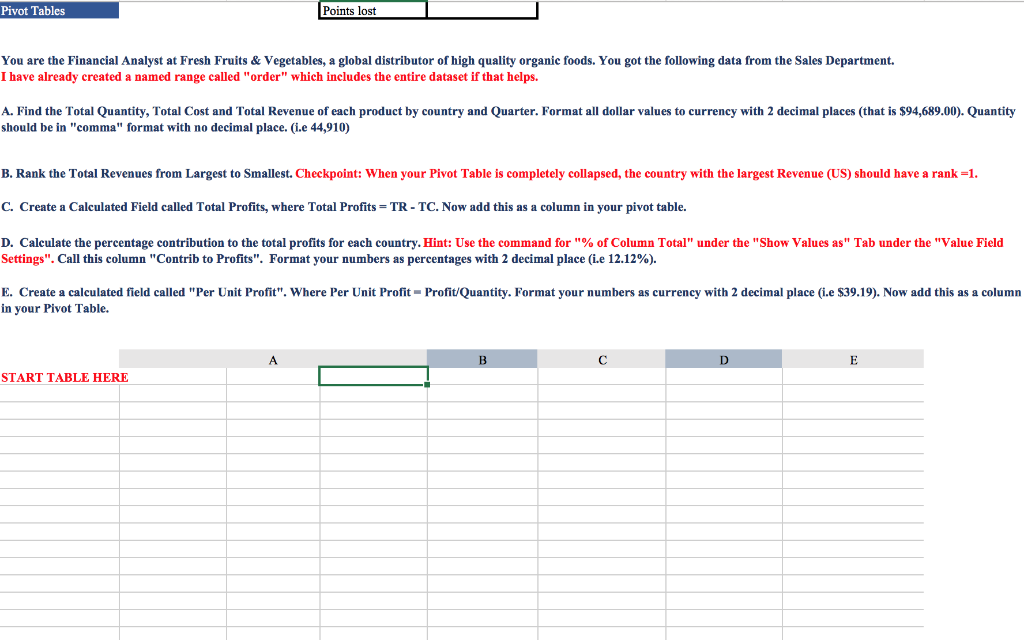
Pivot Tables Data Oder Date Quantity Country 1/6/16 United States 1/7/16 United Kingdom 1/8/16 United States 1/10/16 Canada 1/10/16 Germany 1/11/16 United States 1/11/16 Australia 1/16/16 New Zealand 1/16/16 France 1/16/16 Canada 1/16/16 Germany 1/18/16 United States 1/20/16 Germany 1/22/16 Canada 1/24/16 France 1/27/16 United Kingdom 1/28/16 United States 1/30/16 United Kingdom 1/30/16 United Kingdom 2/2/16 United States 2/4/16 France Product 1,942 Carrots 2,279 Broccoli 1,898 Banana 1,553 Banana 2,389 Beans 1,582 Orange 2,319 Broccoli 1,958 Banana 1,515 Apple 1,872 Apple 2,058 Banana 1,586 Broccoli 1,098 Carrots 1,908 Broccoli 1,061 Apple 1,486 Banana 2,272 Banana 1,014 Banana 1,493 Broccoli 2,271 Apple 1,045 Orange Category Vegetables Vegetables Fruit Fruit Vegetables Fruit Vegetables Fruit Fruit Fruit Fruit Vegetables Vegetables Vegetables Fruit Fruit Fruit Fruit Vegetables Fruit Fruit Revenue $97,1001 $79,7651 $37,960 $31,060 $138,562 $53,788 $81,165 $39,1601 $134,835) $166,608 $41,1601 $55,5101 $54,900 $66,7801 $94,429 $29,7201 $45,4401 $20,280 $52,2551 $202,119 $35,530 $3,145 $3,078 $3,997 $4,069) $2,367 $4,734 $3,2971 $3,178) $3,946 $4,921 $4,657 $3,0401 $3,456 $4,281) $2,882 $4,351 $2,314 $4,145 $2,027 $3,888 $4,283 Pivot Tables Points lost You are the Financial Analyst at Fresh Fruits & Vegetables, a global distributor of high quality organic foods. You got the following data from the Sales Department. I have already created a named range called "order" which includes the entire dataset if that helps. A. Find the Total Quantity, Total Cost and Total Revenue of each product by country and Quarter. Format all dollar values to currency with 2 decimal places (that is $94,689.00). Quantity should be in "comma" format with no decimal place. (..e 44,910) B. Rank the Total Revenues from Largest to Smallest. Checkpoint: When your Pivot Table is completely collapsed, the country with the largest Revenue (US) should have a rank =1. C. Create a Calculated field called Total Profits, where Total Profits = TR - TC. Now add this as a column in your pivot table. D. Calculate the percentage contribution to the total profits for each country. Hint: Use the command for "% of Column Total" under the "Show Values as" Tab under the "Value Field Settings". Call this column "Contrib to Profits". Format your numbers as percentages with 2 decimal place (i.e 12.12%). E. Create a calculated field called "Per Unit Profit". Where Per Unit Profit-Profit/Quantity. Format your numbers as currency with 2 decimal place (ie $39.19). Now add this as a column in your Pivot Table. DE START TABLE HERE

 Please list the functions used in the process of making this pivot table. Thank you


