

Answered step by step
Verified Expert Solution
Question
1 Approved Answer
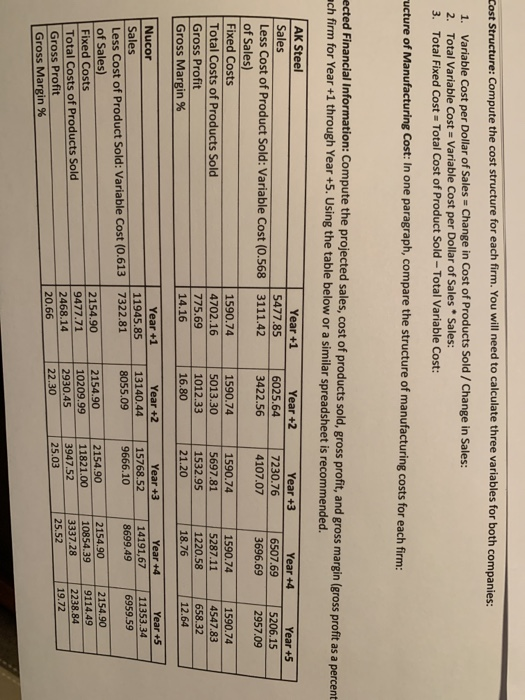
please look at section B and D. Section b. please compare the structure of the manufacturing costs for each of the firms. li one paragraph,
 please look at section B and D.
 Section b. please compare the structure of the manufacturing costs for each of the firms. li one paragraph,
Section D. please do a margin comparrison, please see the second sheet for the information.
Step by Step Solution
There are 3 Steps involved in it
Step: 1

Get Instant Access to Expert-Tailored Solutions
See step-by-step solutions with expert insights and AI powered tools for academic success
Step: 2

Step: 3
Ace Your Homework with AI
Get the answers you need in no time with our AI-driven, step-by-step assistance
Get Started
Principles Of Cost Accounting
Authors: Edward J. Vanderbeck
15th Edition
978-0840037039, 0840037031