 Please look at the above sample as the hint and write code for the Exercise 1 and 2
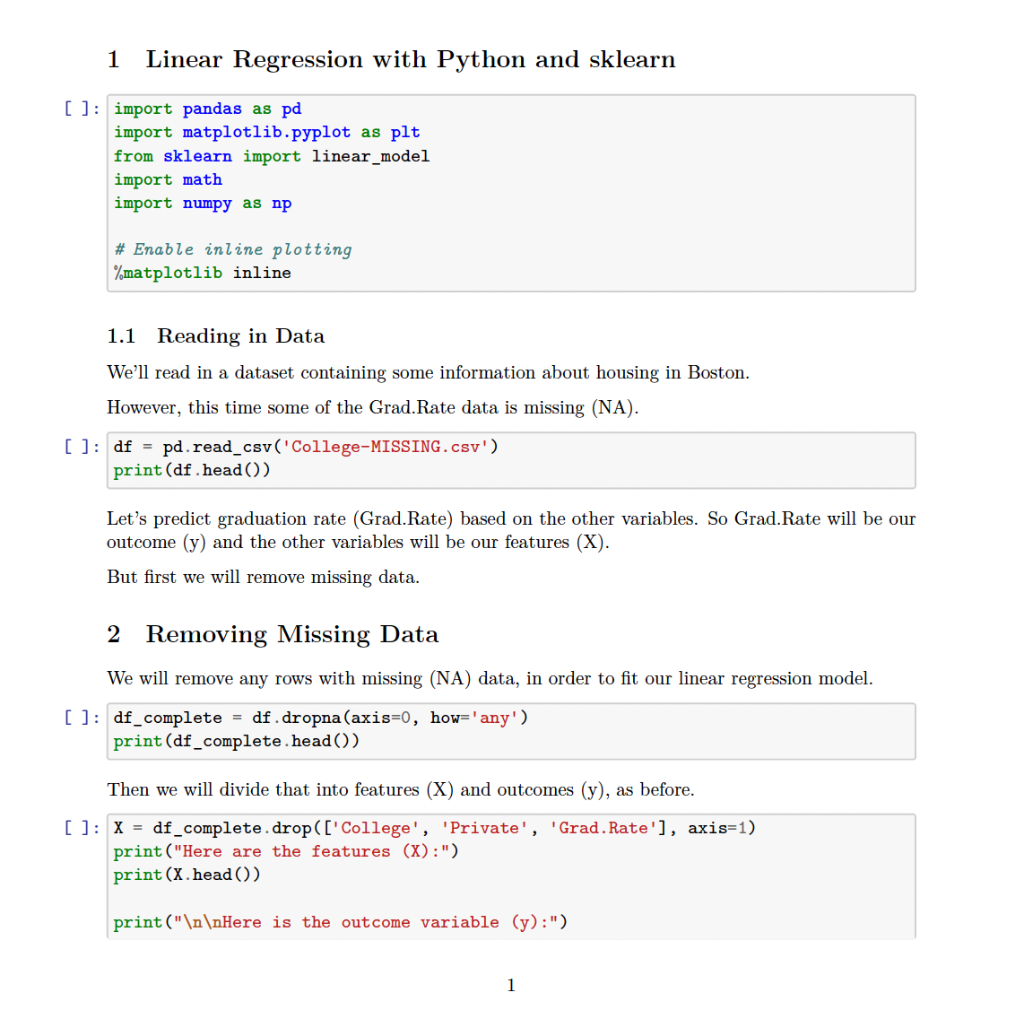
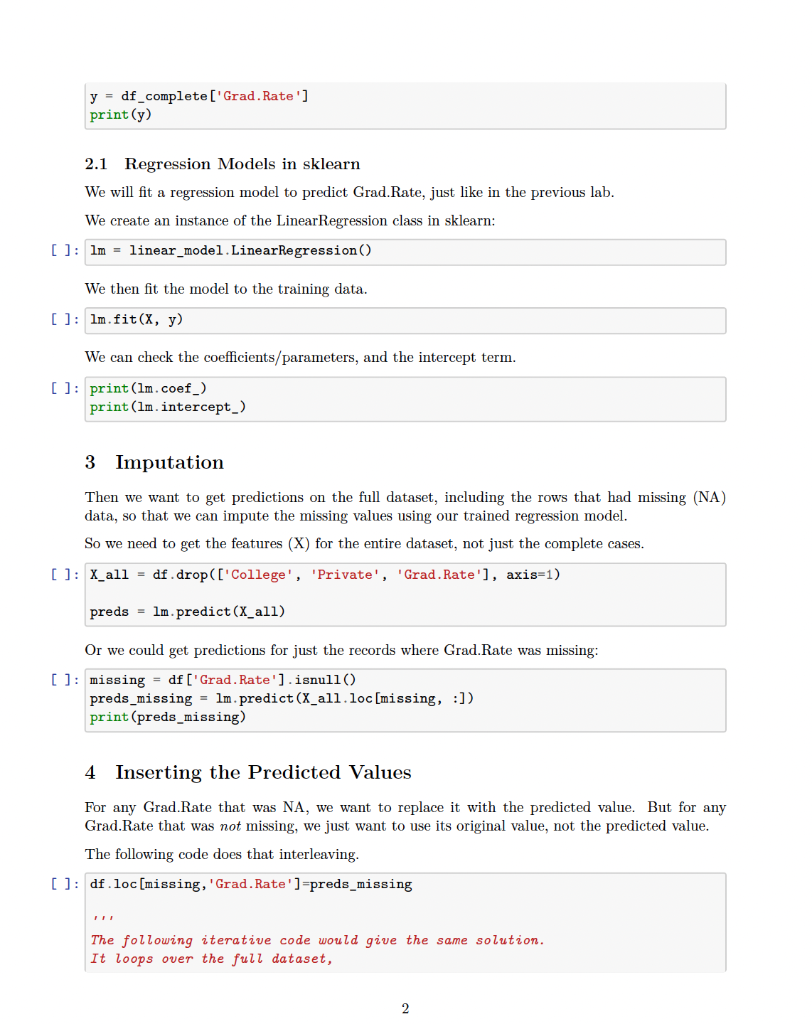
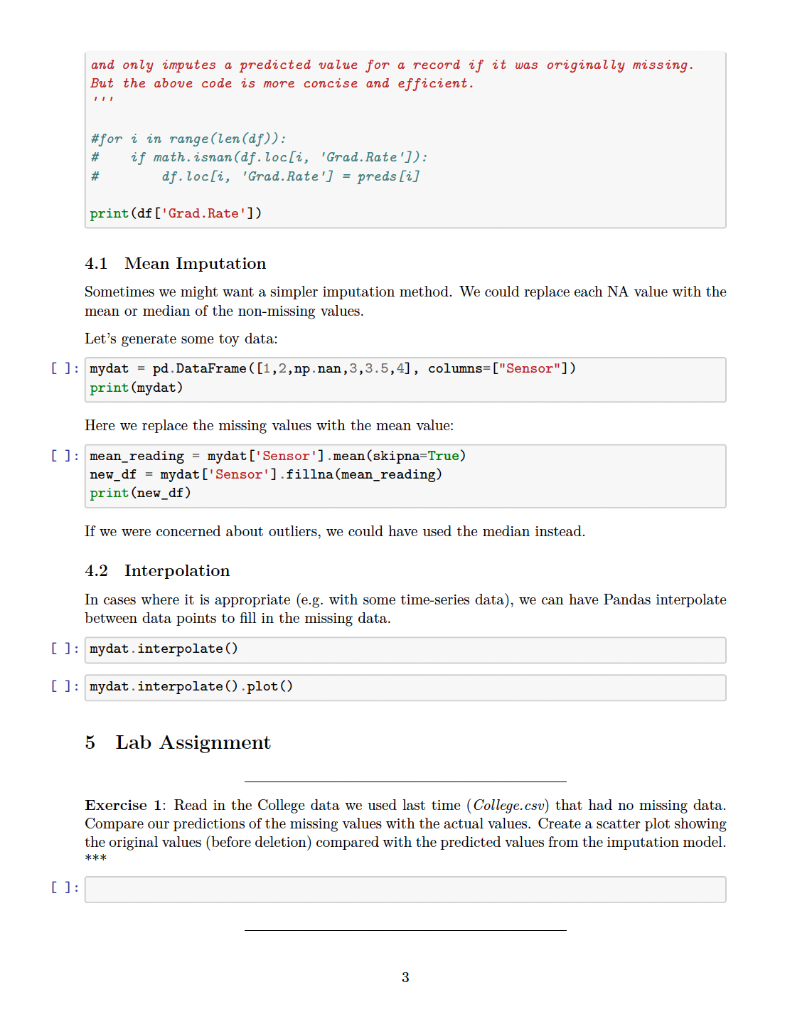
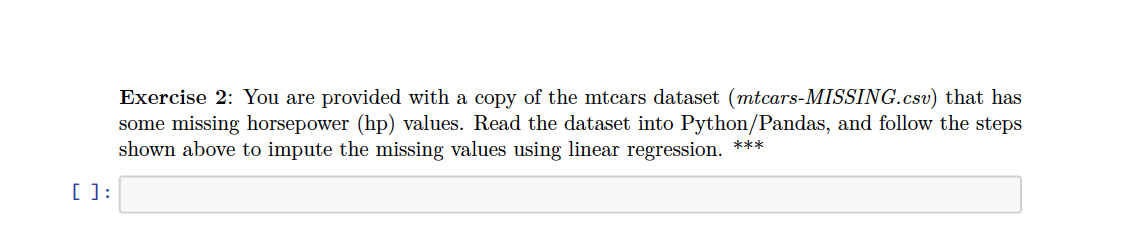
\( \left[\begin{array}{l}\text { [ : import pandas as pd } \\ \text { import matplotlib.pyplot as plt } \\ \text { from sklearn import linear_model } \\ \text { import math } \\ \text { import numpy as np } \\ \text { \# Enable inline plotting } \\ \text { \%matplotlib inline }\end{array} ight. \) 1.1 Reading in Data We'll read in a dataset containing some information about housing in Boston. However, this time some of the Grad.Rate data is missing (NA). [ ] : df = pd.read_csv('College-MISSING.csv' ) print (df . head()) Let's predict graduation rate (Grad.Rate) based on the other variables. So Grad.Rate will be our outcome (y) and the other variables will be our features (X). But first we will remove missing data. 2 Removing Missing Data We will remove any rows with missing (NA) data, in order to fit our linear regression model. [ ] : df_complete =df.dropna( axis =0, how=' any') print(df_complete.head()) Then we will divide that into features (X) and outcomes (y), as before. [ ] : X = df_complete.drop([' College', 'Private', 'Grad. Rate'], axis=1) print("Here are the features (X):") print(X head ()) 2.1 Regression Models in sklearn We will fit a regression model to predict Grad.Rate, just like in the previous lab. We create an instance of the LinearRegression class in sklearn: [ ] : 1ln We then fit the model to the training data. [ ] : We can check the coefficients/parameters, and the intercept term. [ ] : 3 Imputation Then we want to get predictions on the full dataset, including the rows that had missing (NA) data, so that we can impute the missing values using our trained regression model. So we need to get the features (X) for the entire dataset, not just the complete cases. [ ]: X_all = df.drop ([ College', 'Private', 'Grad. Rate' ], axis=1 ) preds =lm predict (Xall) Or we could get predictions for just the records where Grad.Rate was missing: [ ]: missing =df[ 'Grad. Rate'].isnull() preds_missing =1m predict(X_all.loc [missing, : ]) print(preds_missing) 4 Inserting the Predicted Values For any Grad.Rate that was NA, we want to replace it with the predicted value. But for any Grad.Rate that was not missing, we just want to use its original value, not the predicted value. The following code does that interleaving. [ ] : df . loc [missing, 'Grad. Rate']=preds_missing The following iterative code would give the same solution. It loops over the full dataset, 2 and only imputes a predicted value for a record if it was originally missing. But the above code is more concise and efficient. \#for i in range(len (df)) : \# if math. isnan (df.loc[i, 'Grad.Rate']): \# df.loc[i, 'Grad.Rate'] =preds[i] print (df ['Grad.Rate']) 4.1 Mean Imputation Sometimes we might want a simpler imputation method. We could replace each NA value with the mean or median of the non-missing values. Let's generate some toy data: Here we replace the missing values with the mean value: \( \left[\begin{array}{l}\text { [ : } \\ \text { mean_reading = mydat['Sensor '] .mean(skipna=True) } \\ \text { new_df = mydat ['Sensor'] .fillna(mean_reading) } \\ \text { print(new_df) }\end{array} ight. \) If we were concerned about outliers, we could have used the median instead. 4.2 Interpolation In cases where it is appropriate (e.g. with some time-series data), we can have Pandas interpolate between data points to fill in the missing data. [ ]: mydat.interpolate() [] 5 Lab Assignment Exercise 1: Read in the College data we used last time (College.csv) that had no missing data. Compare our predictions of the missing values with the actual values. Create a scatter plot showing the original values (before deletion) compared with the predicted values from the imputation model. Exercise 2: You are provided with a copy of the mtcars dataset (mtcars-MISSING.csv) that has some missing horsepower (hp) values. Read the dataset into Python/Pandas, and follow the steps shown above to impute the missing values using linear regression