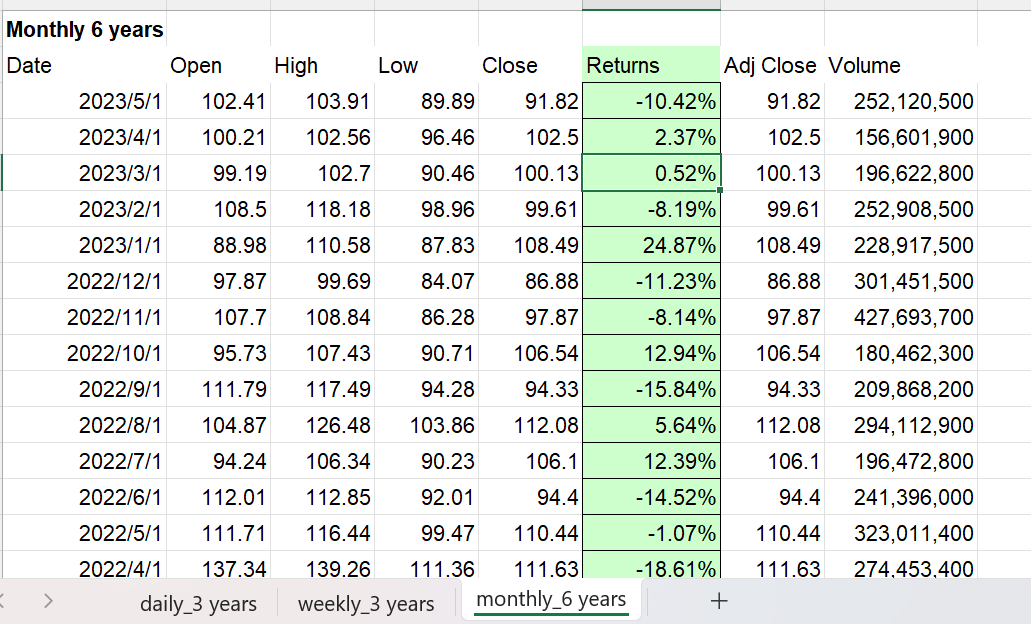
Please look at the attached file and answer the following questions. 1. Did I calculate the Returns correctly? 2. Please teach me how to calculate
Please look at the attached file and answer the following questions.
1. Did I calculate the Returns correctly?
2. Please teach me how to calculate the covariance from the figures on the Excel.
Please show me the examples.
3. Please teach me how to calculate the variance from the figures on the Excel.
Please show me the examples.

Monthly 6 years Date Open High Low Close Returns 2023/5/1 102.41 103.91 89.89 91.82 2023/4/1 100.21 102.56 96.46 102.5 2023/3/1 100.13 99.19 102.7 90.46 108.5 118.18 98.96 99.61 2023/2/1 2023/1/1 88.98 110.58 87.83 108.49 2022/12/1 97.87 99.69 84.07 86.88 2022/11/1 107.7 108.84 86.28 97.87 2022/10/1 95.73 107.43 90.71 106.54 94.28 94.33 112.08 2022/9/1 111.79 117.49 2022/8/1 104.87 126.48 103.86 2022/7/1 94.24 106.34 90.23 106.1 2022/6/1 112.01 112.85 92.01 2022/5/1 111.71 116.44 99.47 2022/4/1 137.34 94.4 110.44 139.26 111.36 111.63 daily 3 years weekly 3 years monthly_6 years Adj Close Volume -10.42% 91.82 252,120,500 2.37% 102.5 156,601,900 0.52% 100.13 196,622,800 -8.19% 99.61 252,908,500 24.87% 108.49 228,917,500 -11.23% 86.88 301,451,500 -8.14% 97.87 427,693,700 12.94% 106.54 180,462,300 -15.84% 94.33 209,868,200 5.64% 112.08 294,112,900 12.39% 106.1 196,472,800 -14.52% 94.4 241,396,000 -1.07% 323,011,400 -18.61% 274,453,400 + 110.44 111.63
Step by Step Solution
3.42 Rating (152 Votes )
There are 3 Steps involved in it
Step: 1
Your Spreadsheet and Calculations 1 Returns Calculation Based on the provided data your calculation ...
See step-by-step solutions with expert insights and AI powered tools for academic success
Step: 2

Step: 3

Ace Your Homework with AI
Get the answers you need in no time with our AI-driven, step-by-step assistance
Get Started


