

Answered step by step
Verified Expert Solution
Question
1 Approved Answer
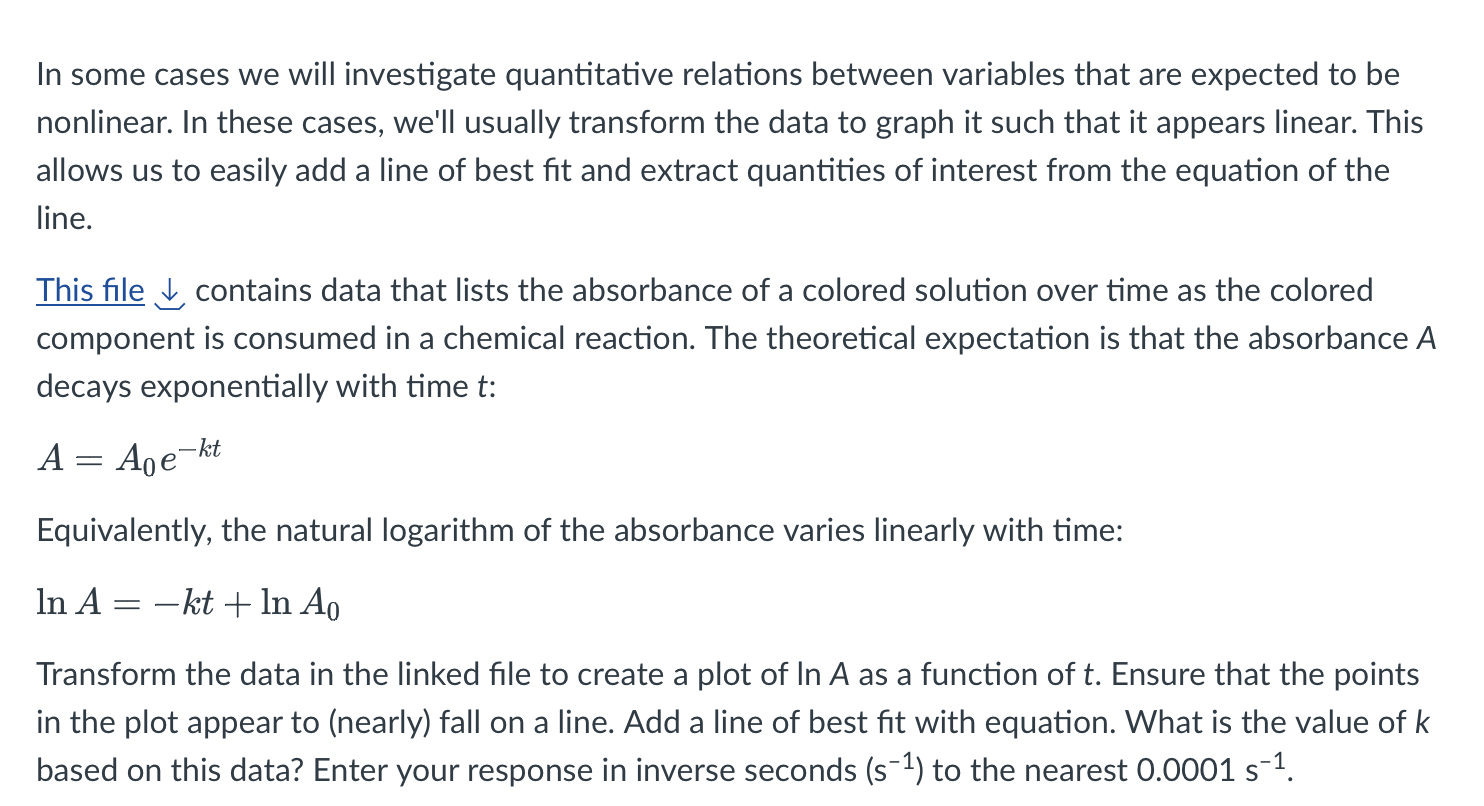
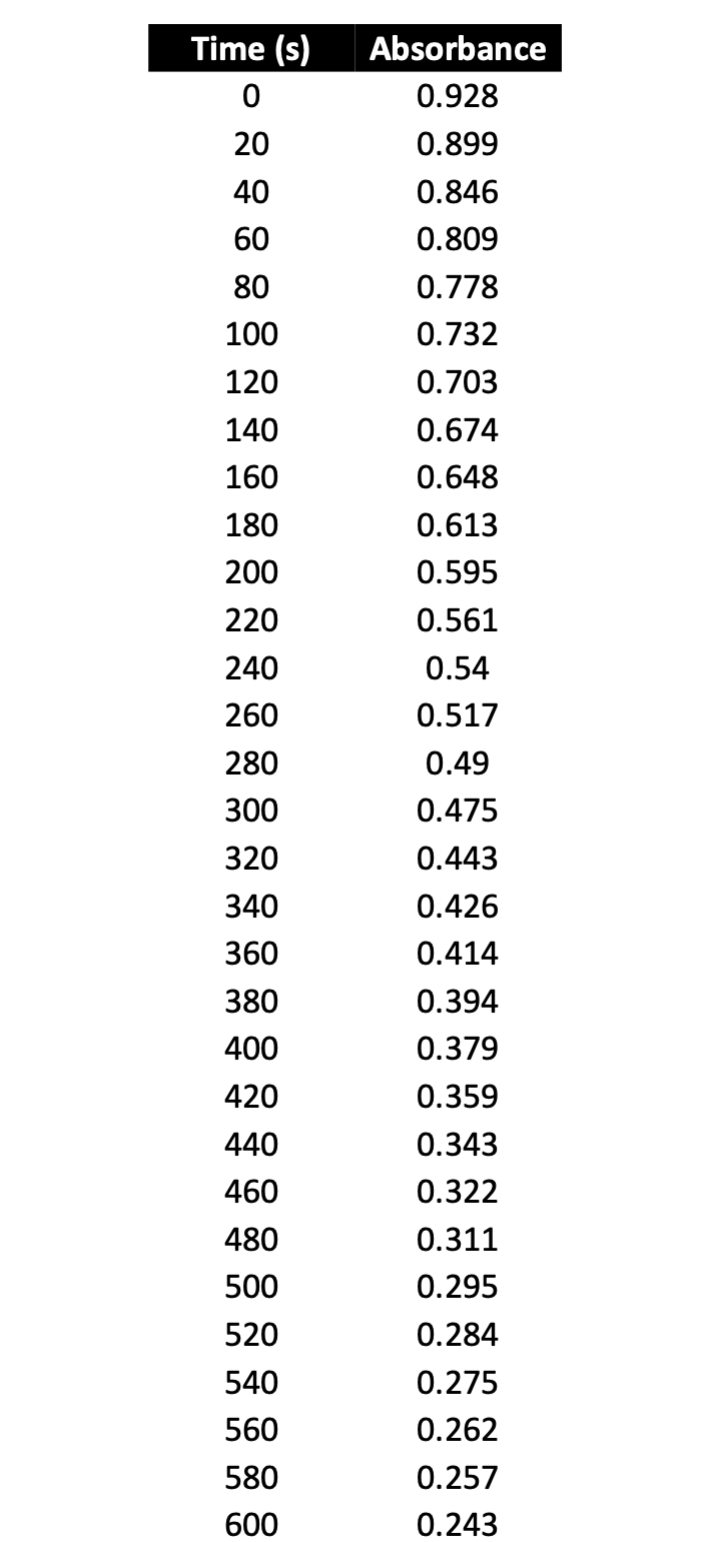
Please look at the image to find the question In some cases we will investigate quantitative relations between variables that are expected to be nonlinear.
Please look at the image to find the question
Step by Step Solution
There are 3 Steps involved in it
Step: 1

Get Instant Access to Expert-Tailored Solutions
See step-by-step solutions with expert insights and AI powered tools for academic success
Step: 2

Step: 3
Ace Your Homework with AI
Get the answers you need in no time with our AI-driven, step-by-step assistance
Get Started
Organic Chemistry
Authors: John E. McMurry
8th Edition
840054440, 978-0840054449