Answered step by step
Verified Expert Solution
Link Copied!

Question

1 Approved Answer

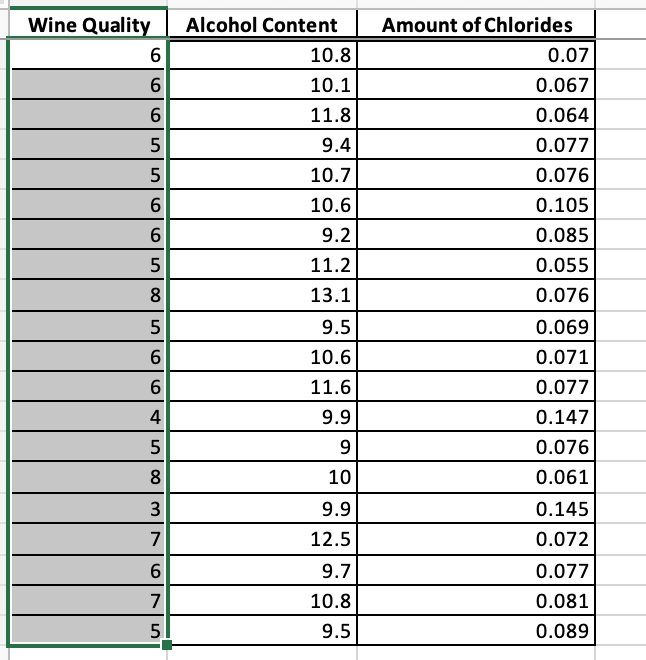
Please look at the picture to answer the question. The production of wine is a multi-billion-dollar worldwide industry. In an attempt to develop a model

Please look at the picture to answer the question.

image text in transcribedimage text in transcribedimage text in transcribedimage text in transcribedimage text in transcribedimage text in transcribed
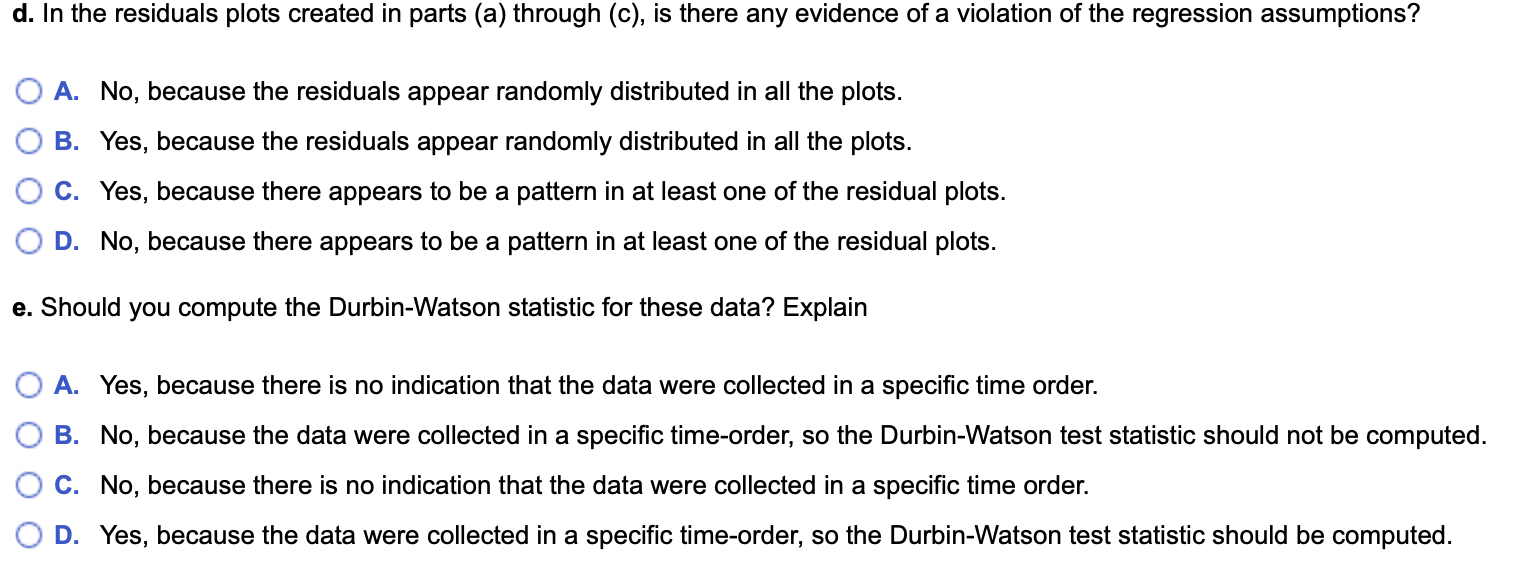
The production of wine is a multi-billion-dollar worldwide industry. In an attempt to develop a model of wine quality as judged by wine experts, data was collected from red wine variants from a particular type of foreign wine. The multiple linear regression model Y; = 3.285 + 0.429X1; - 24.911X2; was developed from a sample of 20 wines, where Y, is the wine quality, measured on a scale from 0 (very bad) to 10 (excellent) based on the alcohol content (%), X1;, and the amount of chlorides, X2j. Use the regression model and the accompanying data to complete parts (a) through (e) below.\fa. Plot the residuals versus Y . Choose the correct graph below. O A. OB. O C. O D. 4- 4- + Residuals Residuals 0- . . . Residuals Residuals O- . . 6 6 C - 6 6 Predicted Y Predicted Y Predicted Y Predicted Yb. Plot the residuals versus X,; . Choose the correct graph below. O A. O B. O c. OD. 4- Residuals 4- O- Residuals O - Residuals 0-. Residuals 8 10 12 1 4- -4- X1 10 12 14 X1 10 12 14 8 X1 10 12 14 X1c. Plot the residuals versus X2; . Choose the correct graph below. O A. O B. O c. O D. 4- Residuals 4- O- Residuals Residuals . . -41 Residuals 0.2 X2 0.2 X2 0.2 -4- X2 0.2 X2d. In the residuals plots created in parts (a) through (c), is there any evidence of a violation of the regression assumptions? 0 A. No, because the residuals appear randomly distributed in all the plots. 0 B. Yes, because the residuals appear randomly distributed in all the plots. 0 C. Yes. because there appears to be a pattern in at least one of the residual plots. O D. No, because there appears to be a pattern in at least one of the residual plots. 9. Should you compute the Durbin-Watson statistic for these data? Explain O A. Yes, because there is no indication that the data were collected in a specic time order. O B. No, because the data were collected in a specic timeorder, so the DurbinWatson test statistic should not be computed. O C. No, because there is no indication that the data were collected in a specic time order. 0 D. Yes, because the data were collected in a specic timeorder, so the Durbin-Watson test statistic should be computed

Step by Step Solution

There are 3 Steps involved in it

Step: 1

blur-text-image

Get Instant Access to Expert-Tailored Solutions

See step-by-step solutions with expert insights and AI powered tools for academic success

Step: 2

blur-text-image_2

Step: 3

blur-text-image_3

Ace Your Homework with AI

Get the answers you need in no time with our AI-driven, step-by-step assistance

Get Started

Recommended Textbook for

Probability and Stochastic Processes A Friendly Introduction for Electrical and Computer Engineers

Authors: Roy D. Yates, David J. Goodman

3rd edition

1118324560, 978-1118324561

More Books

Students also viewed these Mathematics questions

Question

Discuss the difference between managers and leaders.

Answered: 1 week ago