(Please look at the pictures linked to see the "graphs") Thank You
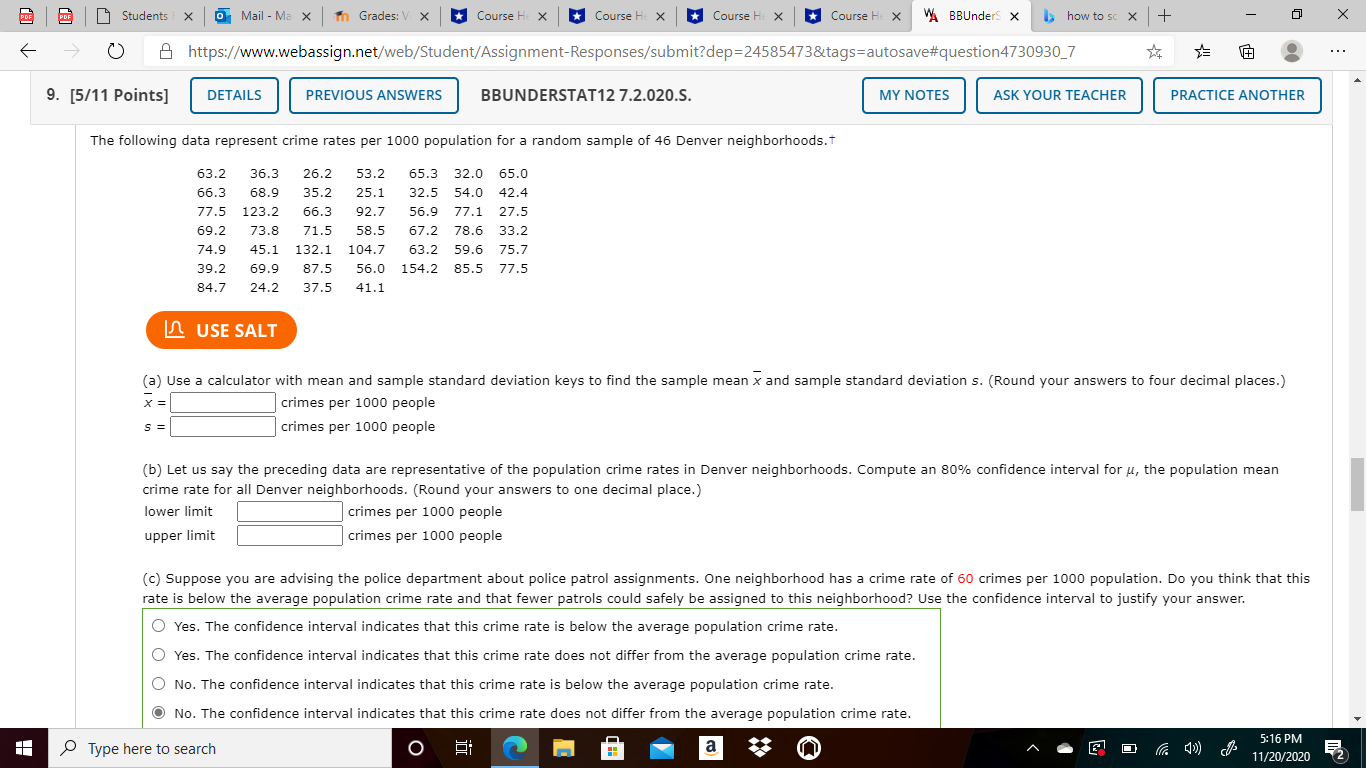
(a) Use a calculator with mean and sample standard deviation keys to find the sample meanxand sample standard deviations. (Round your answers to four decimal places.)
x=________crimes per 1000 people
s=________crimes per 1000 people
(b) Let us say the preceding data are representative of the population crime rates in Denver neighborhoods. Compute an 80% confidence interval for?, the population mean crime rate for all Denver neighborhoods. (Round your answers to one decimal place.)
lower limit______crimes per 1000 people
upper limit______crimes per 1000 people
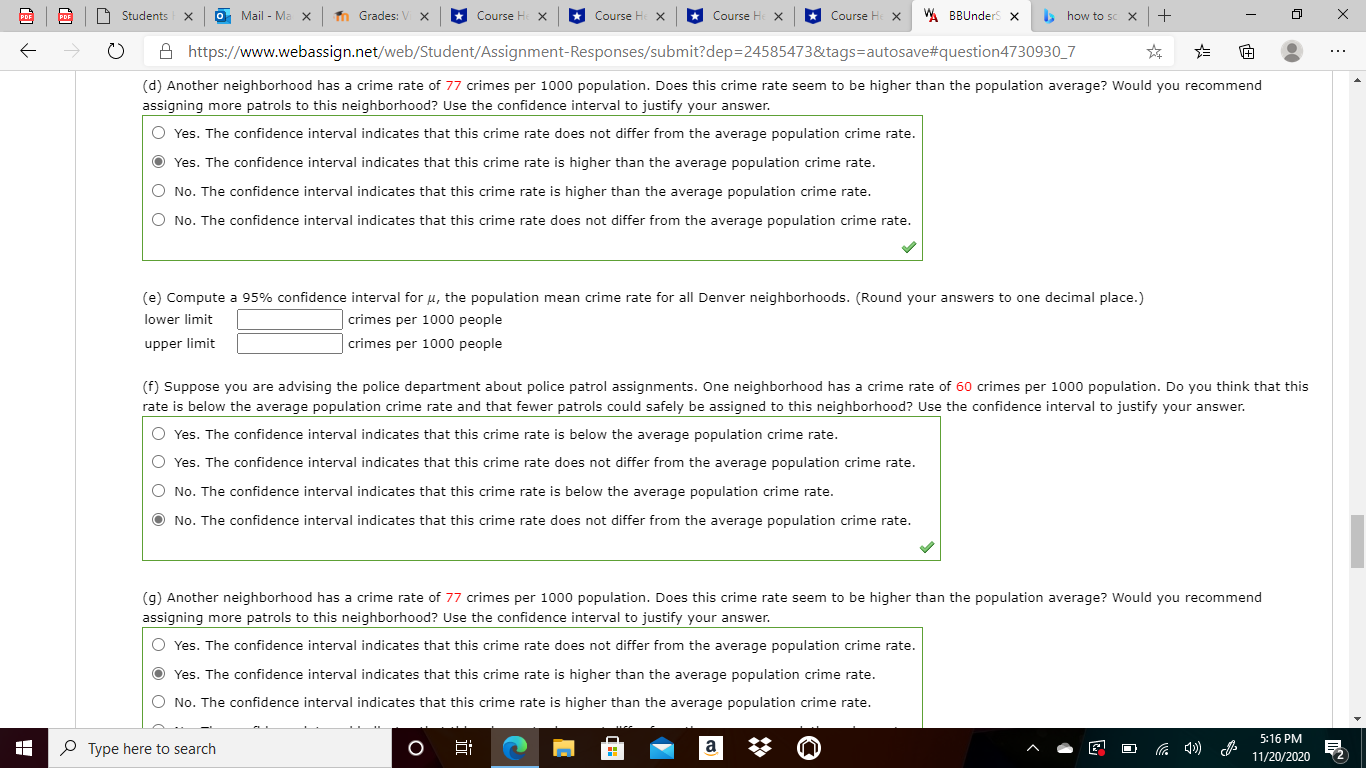
(e) Compute a 95% confidence interval for?, the population mean crime rate for all Denver neighborhoods. (Round your answers to one decimal place.)
lower limit______crimes per 1000 people
upper limit______crimes per 1000 people
am Students X 0 Mail - Ma X In Grades: V X Course He X * Course He X * Course He X Course He X VA BBUnderS X how to sc x + X https://www.webassign.net/web/Student/Assignment-Responses/submit?dep=24585473&tags=autosave#question4730930_7 9. [5/11 Points] DETAILS PREVIOUS ANSWERS BBUNDERSTAT12 7.2.020.S. MY NOTES ASK YOUR TEACHER PRACTICE ANOTHER The following data represent crime rates per 1000 population for a random sample of 46 Denver neighborhoods. t 63.2 36.3 26.2 53.2 65.3 32.0 65.0 66.3 68.9 35.2 25.1 32.5 54.0 42.4 77.5 123.2 66.3 92.7 56.9 77.1 27.5 69.2 73.8 71.5 58.5 67.2 78.6 33.2 74.9 45.1 132.1 104.7 63.2 59.6 39.2 69.9 87.5 56.0 154.2 85.5 77.5 84.7 24.2 37.5 41.1 LO USE SALT (a) Use a calculator with mean and sample standard deviation keys to find the sample mean x and sample standard deviation s. (Round your answers to four decimal places.) crimes per 1000 people S = crimes per 1000 people (b) Let us say the preceding data are representative of the population crime rates in Denver neighborhoods. Compute an 80% confidence interval for u, the population mean crime rate for all Denver neighborhoods. (Round your answers to one decimal place.) lower limit crimes per 1000 people upper limit crimes per 1000 people (c) Suppose you are advising the police department about police patrol assignments. One neighborhood has a crime rate of 60 crimes per 1000 population. Do you think that this rate is below the average population crime rate and that fewer patrols could safely be assigned to this neighborhood? Use the confidence interval to justify your answer. O Yes. The confidence interval indicates that this crime rate is below the average population crime rate. Yes. The confidence interval indicates that this crime rate does not differ from the average population crime rate. O No. The confidence interval indicates that this crime rate is below the average population crime rate. O No. The confidence interval indicates that this crime rate does not differ from the average population crime rate. 5:16 PM Type here to search a 11/20/2020am Students | X 0 Mail - Ma X |In Grades: V X * Course He X * Course He X * Course He X * Course He X VA BBUnderS X how to sc x + X O https://www.webassign.net/web/Student/Assignment-Responses/submit?dep=24585473&tags=autosave#question4730930_7 (d) Another neighborhood has a crime rate of 77 crimes per 1000 population. Does this crime rate seem to be higher than the population average? Would you recommend assigning more patrols to this neighborhood? Use the confidence interval to justify your answer. Yes. The confidence interval indicates that this crime rate does not differ from the average population crime rate. O Yes. The confidence interval indicates that this crime rate is higher than the average population crime rate. O No. The confidence interval indicates that this crime rate is higher than the average population crime rate. No. The confidence interval indicates that this crime rate does not differ from the average population crime rate. (e) Compute a 95% confidence interval for u, the population mean crime rate for all Denver neighborhoods. (Round your answers to one decimal place.) lower limit crimes per 1000 people upper limit crimes per 1000 people (f) Suppose you are advising the police department about police patrol assignments. One neighborhood has a crime rate of 60 crimes per 1000 population. Do you think that this rate is below the average population crime rate and that fewer patrols could safely be assigned to this neighborhood? Use the confidence interval to justify your answer. Yes. The confidence interval indicates that this crime rate is below the average population crime rate. O Yes. The confidence interval indicates that this crime rate does not differ from the average population crime rate. O No. The confidence interval indicates that this crime rate is below the average population crime rate. O No. The confidence interval indicates that this crime rate does not differ from the average population crime rate. (g) Another neighborhood has a crime rate of 77 crimes per 1000 population. Does this crime rate seem to be higher than the population average? Would you recommend assigning more patrols to this neighborhood? Use the confidence interval to justify your answer. Yes. The confidence interval indicates that this crime rate does not differ from the average population crime rate. O Yes. The confidence interval indicates that this crime rate is higher than the average population crime rate. No. The confidence interval indicates that this crime rate is higher than the average population crime rate. Type here to search O a 5:16 PM 11/20/2020


