PLEASE LOOK AT THE WORKSHEET BELOW FOR THE FOLLOWING QUESTIONS:
A -

B -
C -
D -

E -

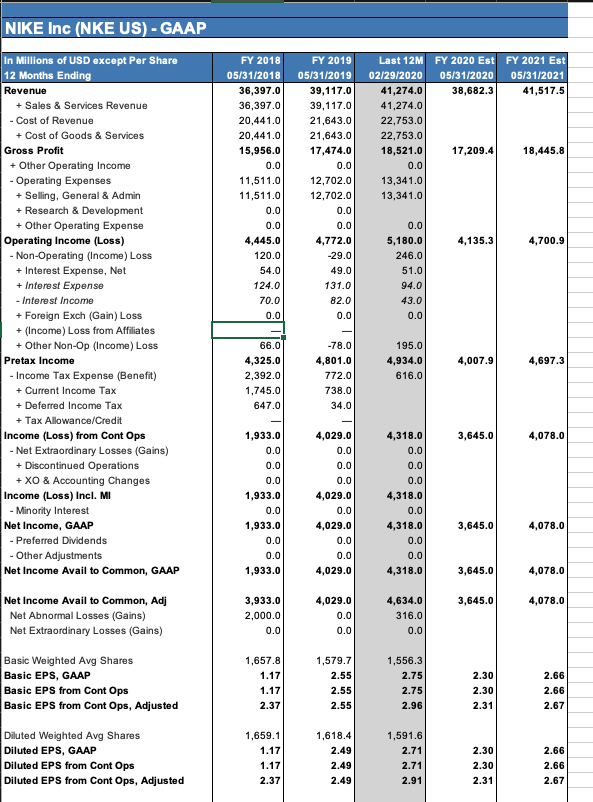
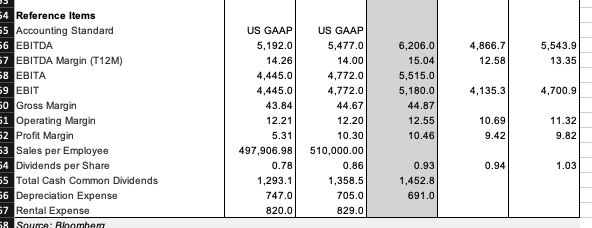
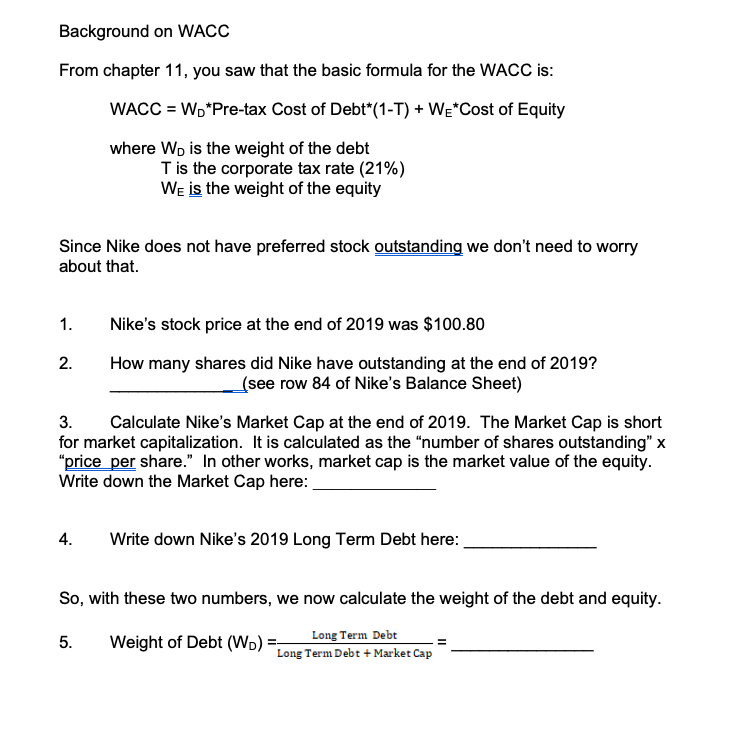
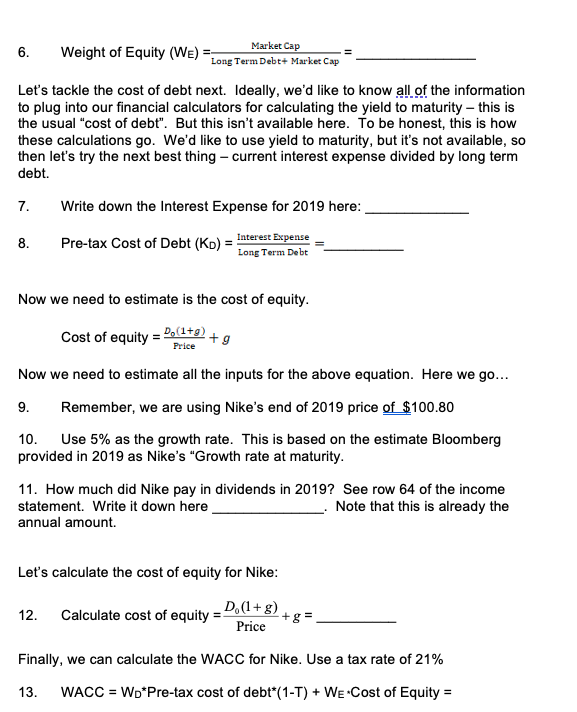
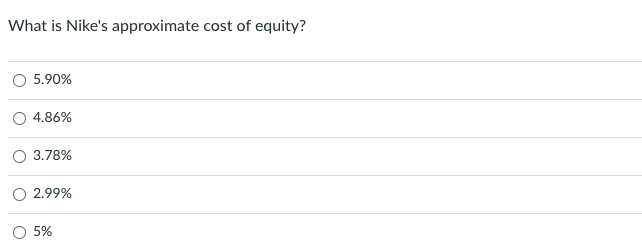
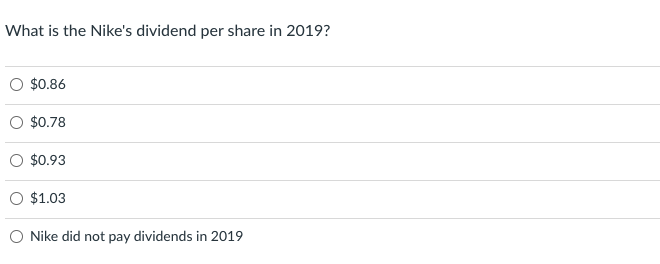
What is Nike's Market Capitalization at the end of 2019? $158,054 million $100,800 million $9,040 million $9,812 million What is Nike's approximate cost of equity? 5.90% 4.86% 3.78% O 2.99% 5% What is the Nike's dividend per share in 2019? $0.86 $0.78 $0.93 $1.03 Nike did not pay dividends in 2019 What is Nike's approximate pre-tax cost of debt using the method outlined on the Module worksheet? O 3.78% 2.99% O 5.90% O 5.83% 5.00% One limitation of our analysis is that the model for finding the cost of equity assumes constant growth in dividends. This may not be a reasonable assumption for a company like Nike that is still growing. O True O False NIKE Inc (NKE US) - GAAP FY 2018 05/31/2018 36,397.0 36,397.0 20,441.0 20,441.0 15,956.0 0.0 11,511.0 11,511.0 0.0 0.0 4,445.0 120.0 54.0 124.0 70.0 0.0 FY 2019 05/31/2019 39,117.0 39,117.0 21,643.0 21,643.0 17,474.0 0.0 12,702.0 12,702.0 0.0 0.0 4,772.0 -29.0 49.0 131.0 82.0 0.0 Last 12M FY 2020 Est FY 2021 Est 02/29/2020 05/31/2020 05/31/2021 41,274.0 38,682.3 41,517.5 41,274.0 22,753.0 22,753.0 18,521.0 17,209.4 18,445.8 0.0 13,341.0 13,341.0 4,135.3 4,700.9 0.0 5,180.0 246.0 51.0 94.0 43.0 0.0 In Millions of USD except Per Share 12 Months Ending Revenue + Sales & Services Revenue - Cost of Revenue + Cost of Goods & Services Gross Profit + Other Operating Income - Operating Expenses + Selling, General & Admin + Research & Development + Other Operating Expense Operating Income (Loss) - Non-Operating (Income) Loss + Interest Expense, Net + interest Expense - Interest Income + Foreign Exch (Gain) Loss + (Income) Loss from Affiliates + Other Non-Op (Income) Loss Pretax Income - Income Tax Expense (Benefit) + Current Income Tax + Deferred Income Tax + Tax Allowance/Credit Income (Loss) from Cont Ops - Net Extraordinary Losses (Gains) + Discontinued Operations + XO & Accounting Changes Income (Loss) Incl. Mi - Minority interest Net Income, GAAP - Preferred Dividends Other Adjustments Net Income Avail to Common, GAAP Net Income Avail to Common, Adj Net Abnormal Losses (Gains) Net Extraordinary Losses (Gains) 4,007.9 66.0 4,325.0 2,392.0 1,745.0 647.0 195.0 4,934.0 616.0 4,697.3 -78.0 4,801.0 772.0 738.0 34.0 3,645.0 4,078.0 1,933.0 0.0 0.0 0.0 1,933.0 0.0 1,933.0 0.0 0.0 1,933.0 4,029.0 0.0 0.0 0.0 4,029.0 0.0 4,029.0 0.0 0.0 4,029.0 4,318.0 0.0 0.0 0.0 4,318.0 0.0 4,318.0 0.0 0.0 4,318.0 3,645.0 4,078.0 3,645.0 4,078.0 3,645.0 4,078.0 3,933.0 2,000.0 0.0 4,029.0 0.0 0.0 4,634.0 316.0 0.0 1,657.8 1.17 1.17 2.37 1,579.7 2.55 2.55 2.55 1,556.3 2.75 2.75 2.96 2.30 2.30 2.31 2.66 2.66 2.67 Basic Weighted Avg Shares Basic EPS, GAAP Basic EPS from Cont Ops Basic EPS from Cont Ops, Adjusted Diluted Weighted Avg Shares Diluted EPS, GAAP Diluted EPS from Cont Ops Diluted EPS from Cont Ops, Adjusted 1,659.1 1.17 1.17 2.37 1,618.4 2.49 2.49 2.49 1,591.6 2.71 2.71 2.91 2.30 2.30 2.31 2.66 2.66 2.67 4,866.7 12.58 5,543.9 13.35 4,135.3 54 Reference Items 55 Accounting Standard 66 EBITDA 57 EBITDA Margin (T12M) 58 EBITA 59 EBIT 50 Gross Margin 1 Operating Margin 52 Profit Margin 3 Sales per Employee 4 Dividends per Share 55 Total Cash Common Dividends 56 Depreciation Expense 57 Rental Expense 58 Souma Bloombard 4,700.9 US GAAP 5,192.0 14.26 4,445.0 4,445.0 43.84 12.21 5.31 497,906.98 0.78 1,293.1 747.0 820.0 6,206.0 15.04 5,515.0 5,180.0 44.87 12.55 10.46 US GAAP 5,477.0 14.00 4,772.0 4,772.0 44.67 12.20 10.30 510,000.00 0.86 1,358.5 705.0 829.0 10.69 9.42 11.32 9.82 0.94 1.03 0.93 1,452.8 691.0 Background on WACC From chapter 11, you saw that the basic formula for the WACC is: WACC = W. *Pre-tax Cost of Debt*(1-T) + WE*Cost of Equity where Wo is the weight of the debt T is the corporate tax rate (21%) We is the weight of the equity Since Nike does not have preferred stock outstanding we don't need to worry about that. 1. Nike's stock price at the end of 2019 was $100.80 2. How many shares did Nike have outstanding at the end of 2019? (see row 84 of Nike's Balance Sheet) 3. Calculate Nike's Market Cap at the end of 2019. The Market Cap is short for market capitalization. It is calculated as the "number of shares outstanding" X "price per share." In other works, market cap is the market value of the equity. Write down the Market Cap here: 4. Write down Nike's 2019 Long Term Debt here: So, with these two numbers, we now calculate the weight of the debt and equity. 5. Weight of Debt (WD) Long Term Debt Long Term Debt + Market Cap 6. Weight of Equity (WE) Market Cap Long Term Debt+ Market Cap Let's tackle the cost of debt next. Ideally, we'd like to know all of the information to plug into our financial calculators for calculating the yield to maturity - this is the usual "cost of debt". But this isn't available here. To be honest, this is how these calculations go. We'd like to use yield to maturity, but it's not available, so then let's try the next best thing - current interest expense divided by long term debt. 7. Write down the Interest Expense for 2019 here: 8. Pre-tax Cost of Debt (ko) = Interest Expense Long Term Debt Now we need to estimate is the cost of equity. Cost of equity = Do(1+0)+g Price Now we need to estimate all the inputs for the above equation. Here we go... 9. Remember, we are using Nike's end of 2019 price of $100.80 10. Use 5% as the growth rate. This is based on the estimate Bloomberg provided in 2019 as Nike's "Growth rate at maturity. 11. How much did Nike pay in dividends in 2019? See row 64 of the income statement. Write it down here Note that this is already the annual amount Let's calculate the cost of equity for Nike: 12. Calculate cost of equity = D. (1+g) + g = Price Finally, we can calculate the WACC for Nike. Use a tax rate of 21% 13. WACC = Wo*Pre-tax cost of debt*(1-T) + We Cost of Equity =


