Answered step by step
Verified Expert Solution
Question
1 Approved Answer
please make this assignment for me Task 2: LO2 You have been asked by your supervisor to show your ability to analyze and evaluate qualitative


please make this assignment for me
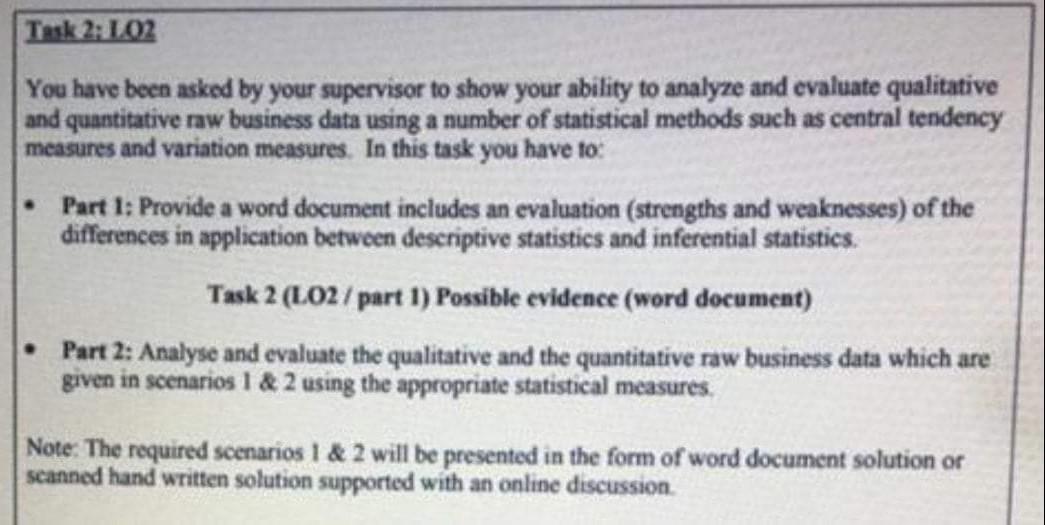
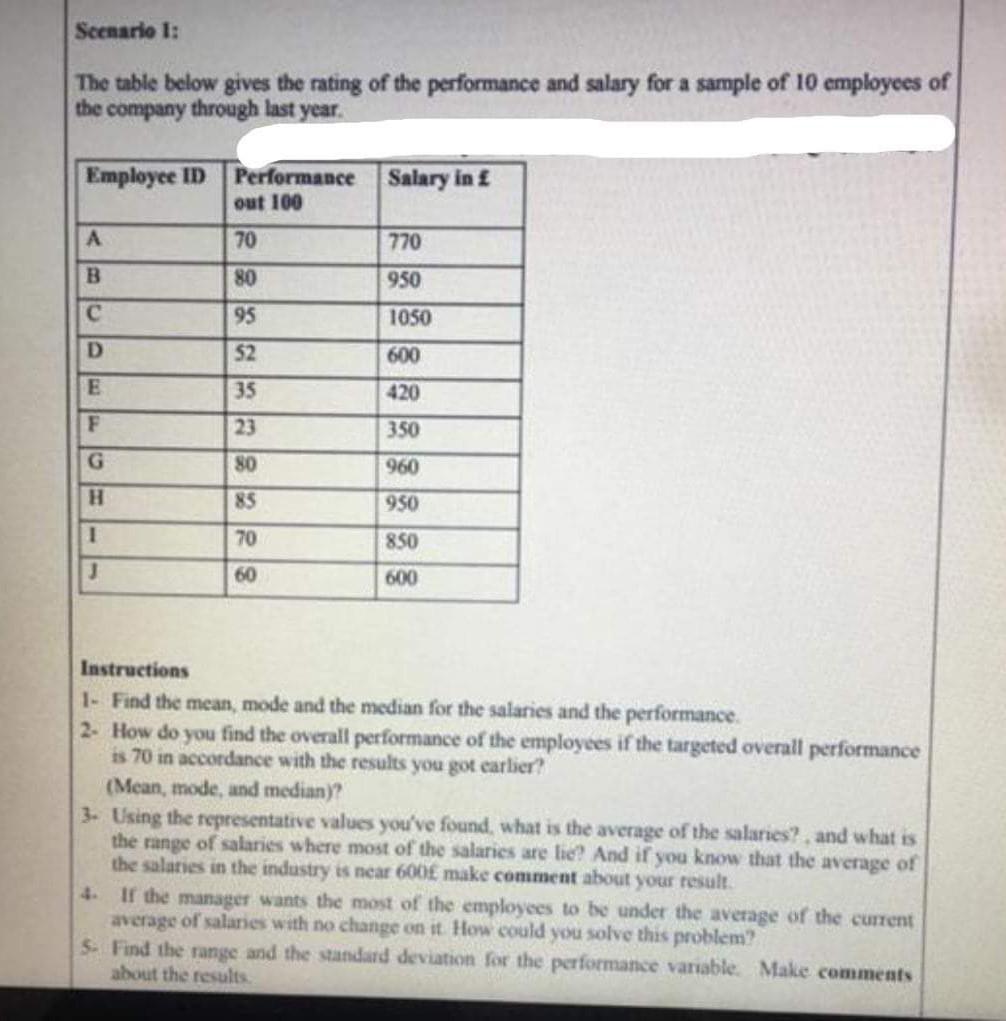
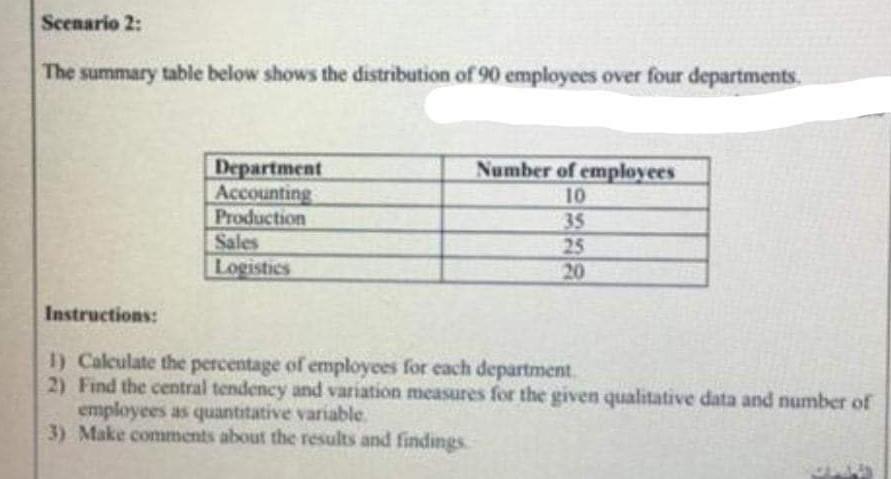
Task 2: LO2 You have been asked by your supervisor to show your ability to analyze and evaluate qualitative and quantitative raw business data using a number of statistical methods such as central tendency measures and variation measures. In this task you have to: Part 1: Provide a word document includes an evaluation (strengths and weaknesses) of the differences in application between descriptive statistics and inferential statistics. Task 2 (LO2 / part 1) Possible evidence (word document) Part 2: Analyse and evaluate the qualitative and the quantitative raw business data which are given in scenarios 1 & 2 using the appropriate statistical measures. Note: The required scenarios 1 & 2 will be presented in the form of word document solution or scanned hand written solution supported with an online discussion Scenario I: The table below gives the rating of the performance and salary for a sample of 10 employees of the company through last year. Employee ID Performance Salary in out 100 A 70 770 B 80 950 95 1050 D 600 52 35 E 420 F 350 80 960 85 950 1 70 850 J 60 600 Instructions 1- Find the mean, mode and the median for the salaries and the performance 2. How do you find the overall performance of the employees if the targeted overall performance is 70 in accordance with the results you got earlier? (Mean, mode, and median)? 3. Using the representative values you've found, what is the average of the salaries?, and what is the range of salaries where most of the salaries are lie? And if you know that the average of the salaries in the industry is near 600 make comment about your result 4. If the manager wants the most of the employees to be under the average of the current average of salaries with no change on it. How could you solve this problem? 5. Find the range and the standard deviation for the performance variable. Make comments about the results Exit Fullscreen (Guide line: you need to comment on how the data are dispersed and how it affect the company) 6- Explain how we can draw conclusions about the entire organization using the findings before Scenario 2: The summary table below shows the distribution of 90 employees over four departments, Department Accounting Production Sales Logistics Number of employees 10 35 25 20 Instructions: 1) Calculate the percentage of employees for each department 2) Find the central tendency and variation measures for the given qualitative data and number of employees as quantitative variable 3) Make comments about the results and findingsStep by Step Solution
There are 3 Steps involved in it
Step: 1

Get Instant Access to Expert-Tailored Solutions
See step-by-step solutions with expert insights and AI powered tools for academic success
Step: 2

Step: 3

Ace Your Homework with AI
Get the answers you need in no time with our AI-driven, step-by-step assistance
Get Started


