PLEASE NO WRITTEN WORK, please show work so I can understand and fully complete problem.
Thank You
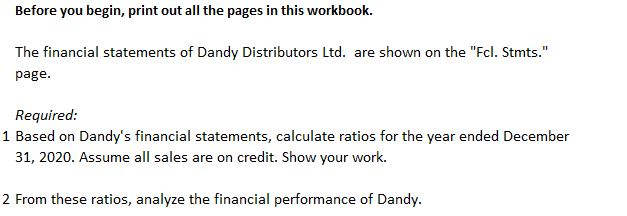
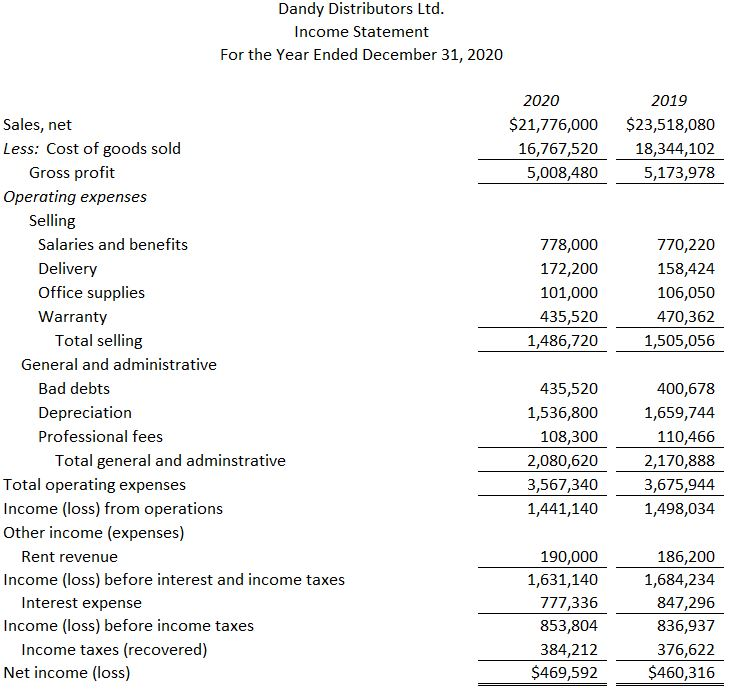
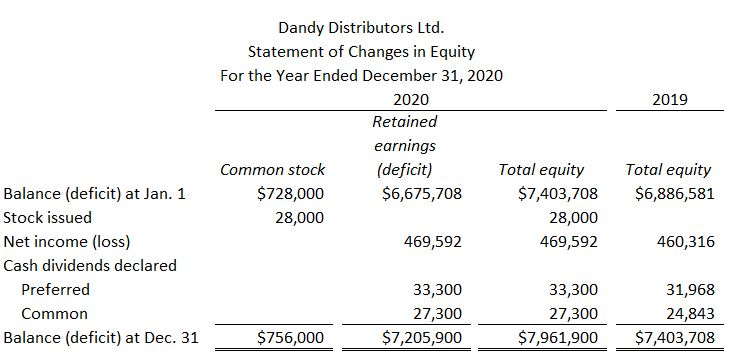
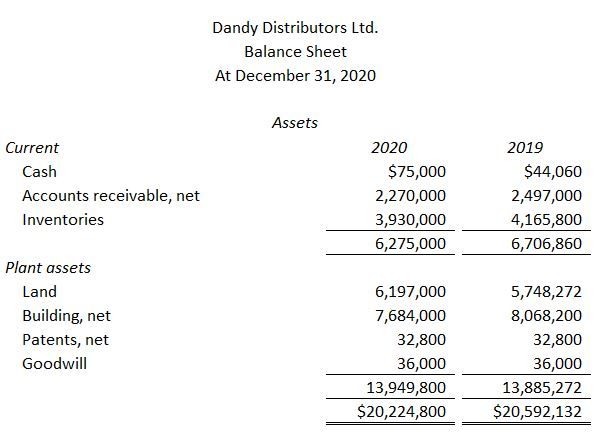
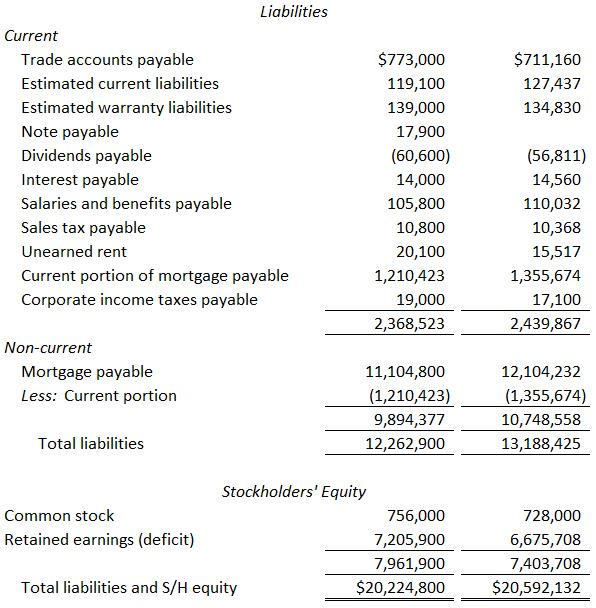
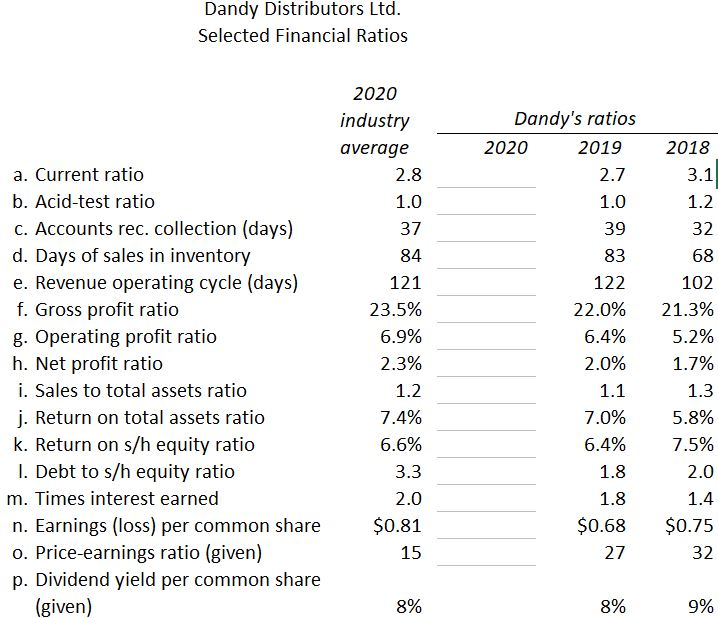
Before you begin, print out all the pages in this workbook The financial statements of Dandy Distributors Ltd. are shown on the "Fcl. Stmts." page Required. 1 Based on Dandy's financial statements, calculate ratios for the year ended December 31, 2020. Assume all sales are on credit. Show your work. 2 From these ratios, analyze the financial performance of Dandy Dandy Distributors Ltd Income Statement For the Year Ended December 31, 2020 2020 2019 $21,776,000 $23,518,080 18,344,102 5,173,978 Sales, net Less: Cost of goods sold 16,767,520 5,008,480 Gross profit Operating expenses Selling Salaries and benefits Delivery Office supplies Warranty 778,000 172,200 101,000 435,520 1,486,720 770,220 158,424 106,050 470,362 1,505,056 Total selling General and administrative Bad debts Depreciation Professional fees 435,520 1,536,800 108,300 2,080,620 3,567,340 1,441,140 400,678 1,659,744 110,466 2,170,888 3,675,944 1,498,034 Total general and adminstrative Total operating expenses Income (loss) from operations Other income (expenses) Rent revenue 190,000 1,631,140 777,336 853,804 384,212 $469,592 186,200 1,684,234 847,296 836,937 376,622 $460,316 Income (loss) before interest and income taxes Income (loss) before income taxes Net income (loss) Interest expense Income taxes (recovered) Dandy Distributors Ltd Statement of Changes in Equity For the Year Ended December 31, 2020 2020 Retained earnings (deficit) 2019 Common stock $728,000 28,000 Total equity Total equity $7,403,708 $6,886,581 $6,675,708 Balance (deficit) at Jan. 1 Stock issued Net income (loss) Cash dividend 28,000 469,592 469,592 460,316 s declared 33,300 27,300 $7,205,900 33,300 27,300 Preferred 31,968 24,843 $7,961,900 $7,403,708 Common $756,000 Balance (deficit) at Dec. 31 Dandy Distributors Ltd Balance Sheet At December 31, 2020 Assets Current 2020 2019 $75,000 2,270,000 3,930,000 6,275,000 $44,060 2,497,000 4,165,800 6,706,860 Cash Accounts receivable, net Inventories Plant assets Land Building, net Patents, net Goodwill 6,197,000 7,684,000 32,800 36,000 13,949,800 $20,224,800 5,748,272 8,068,200 32,800 36,000 13,885,272 20,592,132 Liabilities Current $773,000 119,100 139,000 17,900 (60,600) 14,000 105,800 10,800 20,100 1,210,423 19,000 2,368,523 $711,160 127,437 134,830 Trade accounts payable Estimated current liabilities Estimated warranty liabilities Note payable Dividends payable Interest payable Salaries and benefits payable Sales tax payable Unearned rent Current portion of mortgage payable Corporate income taxes payable (56,811) 14,560 110,032 10,368 15,517 1,355,674 17,100 2,439,867 Non-current Mortgage payable Less: Current portion 11,104,800 (1,210,423) 9,894,377 12,262,900 12,104,232 (1,355,674) 10,748,558 13,188,425 Total liabilities Stockholders' Equity Common stock 756,000 7,205,900 7,961,900 $20,224,800 728,000 6,675,708 7,403,708 $20,592,132 Retained earnings (deficit) Total liabilities and S/H equity Dandy Distributors Ltd. Selected Financial Ratios 2020 industry averag Dandy's ratios 2020 2019 2.7 1.0 39 83 122 22.0% 6.4% 2.0% 2018 3.1 1.2 32 68 102 21.3% 5.2% 1.7% 1.3 5.8% 75% 2.0 a. Current ratio b. Acid-test ratio c. Accounts rec. collection (days) d. Days of sales in inventory e. Revenue operating cycle (days) f. Gross profit ratio g. Operating profit ratio h. Net profit ratio i. Sales to total assets ratio j. Return on total assets ratic k. Return on s/h equity ratio I. Debt to s/h equity ratio m. Times interest earned n. Earnings (loss) per common share o. Price-earnings ratio (given) p. Dividend yield per common share 2.8 1.0 37 84 121 23.5% 6.9% 2.3% 1.2 7.4% 6.6% 3.3 2.0 $0.81 15 70% 6.4% 1.8 1.8 $0.68$0.75 32 27 8% 8% 9% given