 Please note!!!! This is not asking for the stock price but rather the TRADING VOLUME AND % CHANGED. I see this question has been posted many times but never giving the right answer to the question.
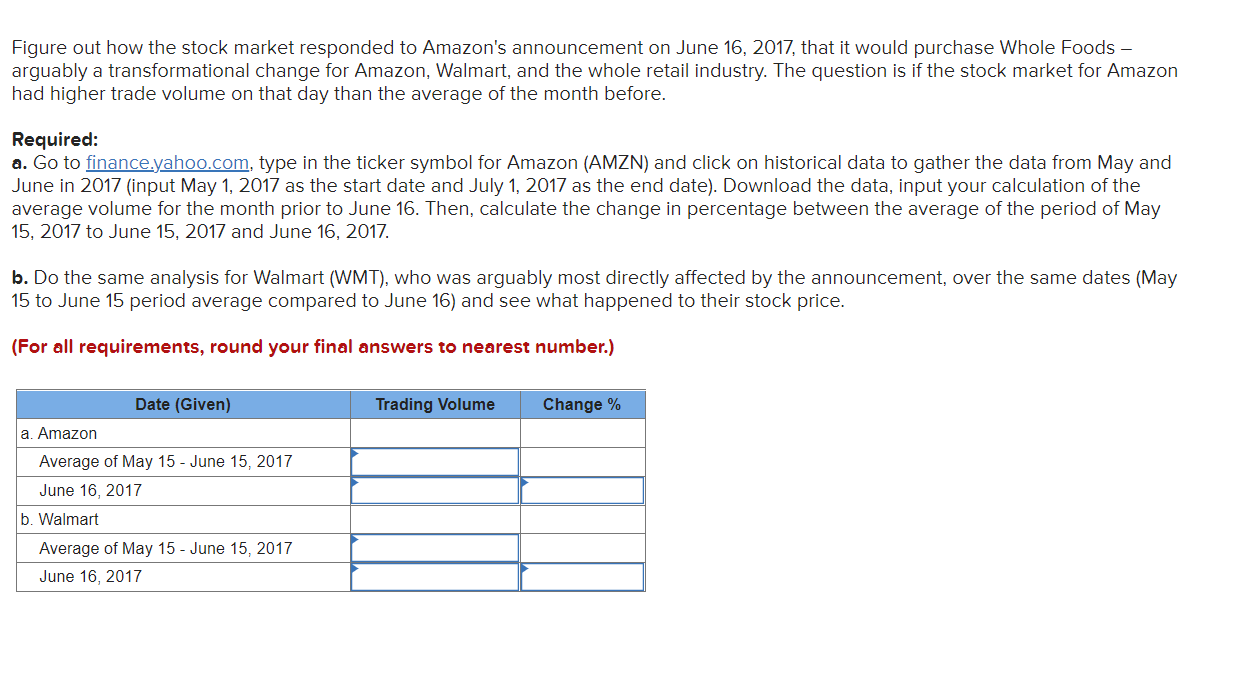
Figure out how the stock market responded to Amazon's announcement on June 16, 2017, that it would purchase Whole Foods - arguably a transformational change for Amazon, Walmart, and the whole retail industry. The question is if the stock market for Amazon had higher trade volume on that day than the average of the month before. Required: a. Go to finance.yahoo.com, type in the ticker symbol for Amazon (AMZN) and click on historical data to gather the data from May and June in 2017 (input May 1, 2017 as the start date and July 1, 2017 as the end date). Download the data, input your calculation of the average volume for the month prior to June 16. Then, calculate the change in percentage between the average of the period of May 15, 2017 to June 15, 2017 and June 16, 2017. b. Do the same analysis for Walmart (WMT), who was arguably most directly affected by the announcement, over the same dates (May 15 to June 15 period average compared to June 16) and see what happened to their stock price. (For all requirements, round your final answers to nearest number.) Trading Volume Change % Date (Given) a. Amazon Average of May 15 - June 15, 2017 June 16, 2017 b. Walmart Average of May 15 - June 15, 2017 June 16, 2017 Figure out how the stock market responded to Amazon's announcement on June 16, 2017, that it would purchase Whole Foods - arguably a transformational change for Amazon, Walmart, and the whole retail industry. The question is if the stock market for Amazon had higher trade volume on that day than the average of the month before. Required: a. Go to finance.yahoo.com, type in the ticker symbol for Amazon (AMZN) and click on historical data to gather the data from May and June in 2017 (input May 1, 2017 as the start date and July 1, 2017 as the end date). Download the data, input your calculation of the average volume for the month prior to June 16. Then, calculate the change in percentage between the average of the period of May 15, 2017 to June 15, 2017 and June 16, 2017. b. Do the same analysis for Walmart (WMT), who was arguably most directly affected by the announcement, over the same dates (May 15 to June 15 period average compared to June 16) and see what happened to their stock price. (For all requirements, round your final answers to nearest number.) Trading Volume Change % Date (Given) a. Amazon Average of May 15 - June 15, 2017 June 16, 2017 b. Walmart Average of May 15 - June 15, 2017 June 16, 2017
 Please note!!!! This is not asking for the stock price but rather the TRADING VOLUME AND % CHANGED. I see this question has been posted many times but never giving the right answer to the question.


