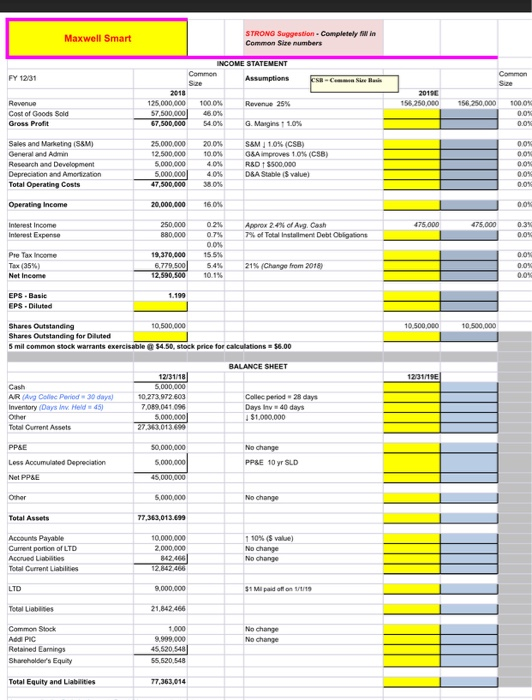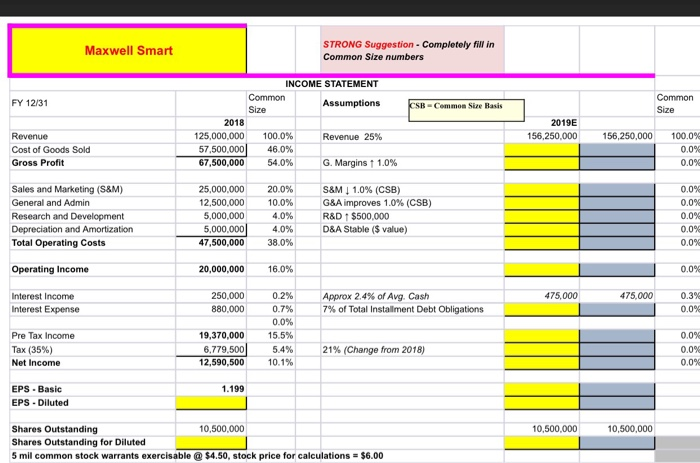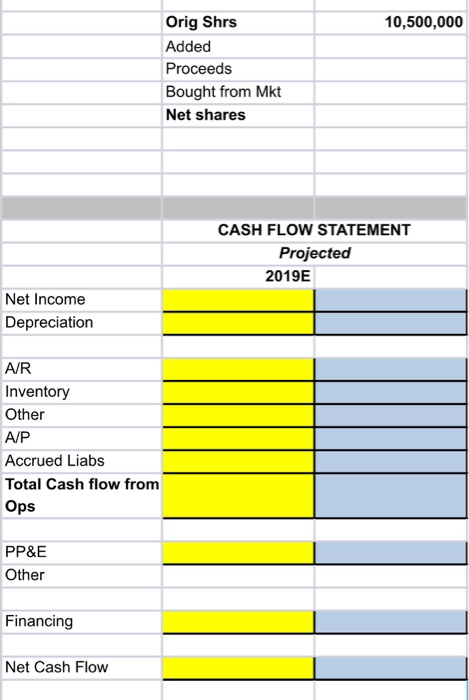
please only do income statement... yellow part....
STRONG Suggestion Completely W in Common Sire numbers Maxwell Smart INCOME STATEMENT Common Sze Common Size FY 12/31 Assumptions cSB-C Sie Rasis 2018 201E 156 250,000 156.250,000 Rovenue 125,000,000 1000% 1000% Revenue 25% 57,500,000 460% Cost of Goods Sold 0.0% G. Maigins 1.0 % Gross Profit 67,500,000 54.0% 0.0% Sales and Marketing (SSM) 25,000.000 20.0% 10.0 % S&M 10 % ( CS8) G&A improves 1.0% ( CSB ) 00% General and Admin 12,500,000 00% 4.0% Research and Development Depreciation and Amorization 5,000,000 R&D $500,000 D&A Stable (S value) 0.0% 5,000.000 4.0 % 00 38.0% Total Operating Costs 47,500,000 0.0% 16.0 % Operating Income 00% 20,000.000 Approx 2.4% of Avg. Cash 7% of Total Instalment Debt Obligations Interest Income Interest Expense 250,000 880,000 0.2% 475.000 475,000 0.3% 07 % 0.0% 0.0% 19,370,000 Pre Tax Inceme 15.5% 00% 6,779.500 5.4 % 21 % ( Change from 2018) Tax (35 % ) Net Income- 0.0% 12.590.500 10.1% 00% EPS Basic 1.199 EPS Diluted 10,500,000 10.500,000 Shares Outstanding Shares Outstanding for Diluted 5 mil common stock warrants exercisable@ $4.50, stock price for calculations $6.00 10.500,000 BALANCE SHEET 12/31/19E 12/31/18 5,000,000 Cash AR (Avg Collec Period 30 days) Inventory (Days inv Held 45) Other Collec period 28 days 10,273,972.603 Days Inv 40 days $1,000.000 7,089.041096 5000.000 2743013.699 Total Current Assets 50.000.000 No change PPSE 5,000,000 Less Accumulated Depreciation PP&E 10 yr SLD 45,000.000 Net PP&E Other 5,000,000 No change Total Assets 77,363,013.699 1 10% ( S value) No change Accounts Payable Current portion of LTD 10.000,000 2,000,000 842.466 Acorued Liabilities No change 12,842466 Total Current Liabilties 9.000,000 LTD $1 M paid offon 1/t/19 Tetal Liabilites 21,842 466 Common Stock 1,000 No change No change Add PIC Retained Eamings 9999.000 45,520.548 Shareholder's Equity 55,520,548 Total Equity and Liabilities 77,363,014 Orig Shrs 10,500,000 Added Proceeds Bought from Mkt Net shares CASH FLOW STATEMENT Projected 2019E Net Income Depreciation A/R Inventory Other A/P Accrued Liabs Total Cash flow from Ops PP&E Other Financing Net Cash Flow STRONG Suggestion Completely fill in Maxwell Smart Common Size numbers INCOME STATEMENT Common Common FY 12/31 Assumptions CSB-Common Size Basis Size Size 2018 2019E 100.0 % Revenue 125,000,000 156,250,000 156,250,000 100.0% Revenue 25 % 46.0 % Cost of Goods Sold 57,500,000 0.0% Gross Profit G. Margins 1.0 % 67,500,000 54.0 % 0.0% Sales and Marketing (S&M) S&M 1.0% ( CSB) G&A improves 1.0 % ( CSB ) R&D 1 $500,000 D&A Stable ($ value) 0.0% 25,000,000 20.0 % 10.0 % General and Admin 12,500,000 0.0% Research and Development Depreciation and Amortization 5,000,000 4.0% 0.0 % 5,000,000 4.0 % 0.0% Total Operating Costs 47,500,000 38.0 % 0.0% Operating Income 20,000,000 16.0% 0.0% Interest Income 250,000 0.2% Approx 2.4 % of Avg. Cash 7% of Total Installment Debt Obligations 475,000 475,000 0.3% Interest Expense 880,000 0.7 % 0.0 % 0.0 % Pre Tax Income 19,370,000 15.5% 0.0% 21% ( Change from 2018) x (35%) 6,779,500 5.4 % 0.0% 0.0% Net Income 12,590,500 10.1% 1.199 EPS Basic EPS Diluted Shares Outstanding Shares Outstanding for Diluted 5 mil common stock warrants exercisable@ $4.50, stock price for calculations $6.00 10,500,000 10,500,000 10,500,000 STRONG Suggestion Completely W in Common Sire numbers Maxwell Smart INCOME STATEMENT Common Sze Common Size FY 12/31 Assumptions cSB-C Sie Rasis 2018 201E 156 250,000 156.250,000 Rovenue 125,000,000 1000% 1000% Revenue 25% 57,500,000 460% Cost of Goods Sold 0.0% G. Maigins 1.0 % Gross Profit 67,500,000 54.0% 0.0% Sales and Marketing (SSM) 25,000.000 20.0% 10.0 % S&M 10 % ( CS8) G&A improves 1.0% ( CSB ) 00% General and Admin 12,500,000 00% 4.0% Research and Development Depreciation and Amorization 5,000,000 R&D $500,000 D&A Stable (S value) 0.0% 5,000.000 4.0 % 00 38.0% Total Operating Costs 47,500,000 0.0% 16.0 % Operating Income 00% 20,000.000 Approx 2.4% of Avg. Cash 7% of Total Instalment Debt Obligations Interest Income Interest Expense 250,000 880,000 0.2% 475.000 475,000 0.3% 07 % 0.0% 0.0% 19,370,000 Pre Tax Inceme 15.5% 00% 6,779.500 5.4 % 21 % ( Change from 2018) Tax (35 % ) Net Income- 0.0% 12.590.500 10.1% 00% EPS Basic 1.199 EPS Diluted 10,500,000 10.500,000 Shares Outstanding Shares Outstanding for Diluted 5 mil common stock warrants exercisable@ $4.50, stock price for calculations $6.00 10.500,000 BALANCE SHEET 12/31/19E 12/31/18 5,000,000 Cash AR (Avg Collec Period 30 days) Inventory (Days inv Held 45) Other Collec period 28 days 10,273,972.603 Days Inv 40 days $1,000.000 7,089.041096 5000.000 2743013.699 Total Current Assets 50.000.000 No change PPSE 5,000,000 Less Accumulated Depreciation PP&E 10 yr SLD 45,000.000 Net PP&E Other 5,000,000 No change Total Assets 77,363,013.699 1 10% ( S value) No change Accounts Payable Current portion of LTD 10.000,000 2,000,000 842.466 Acorued Liabilities No change 12,842466 Total Current Liabilties 9.000,000 LTD $1 M paid offon 1/t/19 Tetal Liabilites 21,842 466 Common Stock 1,000 No change No change Add PIC Retained Eamings 9999.000 45,520.548 Shareholder's Equity 55,520,548 Total Equity and Liabilities 77,363,014 Orig Shrs 10,500,000 Added Proceeds Bought from Mkt Net shares CASH FLOW STATEMENT Projected 2019E Net Income Depreciation A/R Inventory Other A/P Accrued Liabs Total Cash flow from Ops PP&E Other Financing Net Cash Flow STRONG Suggestion Completely fill in Maxwell Smart Common Size numbers INCOME STATEMENT Common Common FY 12/31 Assumptions CSB-Common Size Basis Size Size 2018 2019E 100.0 % Revenue 125,000,000 156,250,000 156,250,000 100.0% Revenue 25 % 46.0 % Cost of Goods Sold 57,500,000 0.0% Gross Profit G. Margins 1.0 % 67,500,000 54.0 % 0.0% Sales and Marketing (S&M) S&M 1.0% ( CSB) G&A improves 1.0 % ( CSB ) R&D 1 $500,000 D&A Stable ($ value) 0.0% 25,000,000 20.0 % 10.0 % General and Admin 12,500,000 0.0% Research and Development Depreciation and Amortization 5,000,000 4.0% 0.0 % 5,000,000 4.0 % 0.0% Total Operating Costs 47,500,000 38.0 % 0.0% Operating Income 20,000,000 16.0% 0.0% Interest Income 250,000 0.2% Approx 2.4 % of Avg. Cash 7% of Total Installment Debt Obligations 475,000 475,000 0.3% Interest Expense 880,000 0.7 % 0.0 % 0.0 % Pre Tax Income 19,370,000 15.5% 0.0% 21% ( Change from 2018) x (35%) 6,779,500 5.4 % 0.0% 0.0% Net Income 12,590,500 10.1% 1.199 EPS Basic EPS Diluted Shares Outstanding Shares Outstanding for Diluted 5 mil common stock warrants exercisable@ $4.50, stock price for calculations $6.00 10,500,000 10,500,000 10,500,000