Please only need help on Table A3 crop assessment cash flows and cash revenue projections for food grade corn expansion
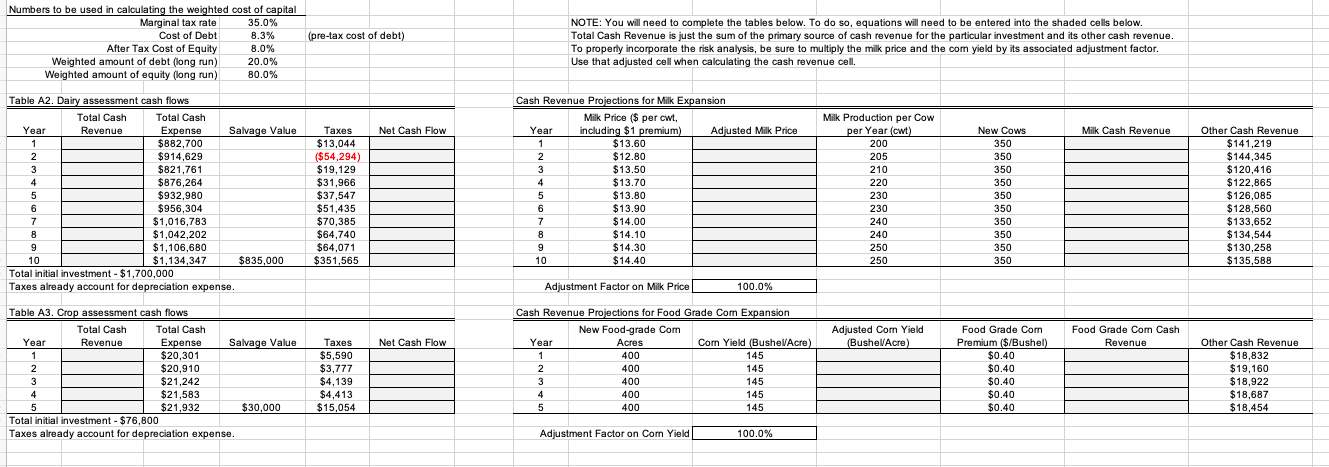
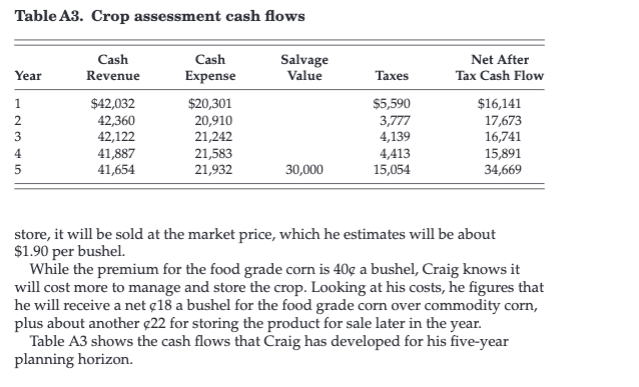
(pre-tax cost of debt) Numbers to be used in calculating the weighted cost of capital Marginal tax rate 35.0% Cost of Debt 8.3% After Tax Cost of Equity 8.0% Weighted amount of debt (long run) 20.0% Weighted amount of equity (long run) 80.0% NOTE: You will need to complete the tables below. To do so, equations will need to be entered into the shaded cells below. Total Cash Revenue is just the sum of the primary source of cash revenue for the particular investment and its other cash revenue. To properly incorporate the risk analysis, be sure to multiply the milk price and the corn yield by its associated adjustment factor. Use that adjusted cell when calculating the cash revenue cell. Net Cash Flow Milk Cash Revenue Table A2. Dairy assessment cash flows Total Cash Total Cash Year Revenue Expense Salvage Value 1 $882,700 2 2 $914,629 3 $821,761 4 $876,264 5 $932,980 6 $956,304 7 $1,016,783 8 $1,042,202 9 $1,106,680 10 $1,134,347 $835,000 Total initial investment - $1,700,000 Taxes already account for depreciation expense. Taxes $13,044 ($54,294) $19,129 $31,966 $37,547 $51,435 $70,385 $64,740 $64,071 $351,565 Cash Revenue Projections for Milk Expansion Milk Price ($ per cwt, Year including $1 premium) Adjusted Milk Price 1 $13.60 2 $12.80 3 $13.50 4 $13.70 5 $13.80 6 $13.90 7 $14.00 8 $14.10 9 $14.30 10 $14.40 Milk Production per Cow per Year (cwt) 200 205 210 220 230 230 240 240 250 250 New Cows 350 350 350 350 350 350 350 350 350 350 Other Cash Revenue $141,219 $144,345 $120,416 $122,865 $126,085 $128,560 $133,652 $134,544 $130,258 $135,588 Adjustment Factor on Milk Price 100.0% Adjusted Com Yield (BushelAcre) Food Grade Com Cash Revenue Net Cash Flow Table A3. Crop assessment cash flows Total Cash Total Cash Year Revenue Expense Salvage Value 1 1 $20,301 2 $20,910 3 $21,242 4 $21,583 5 $21,932 $30,000 Total initial investment - $76,800 Taxes already account for depreciation expense. Taxes $5,590 $3,777 $4,139 $4,413 $15,054 Cash Revenue Projections for Food Grade Com Expansion New Food-grade Com Year Acres Com Yield (BushelAcre 1 400 145 2 400 145 3 400 145 4 400 145 5 400 145 Food Grade Com Premium ($/Bushel) $0.40 $0.40 $0.40 $0.40 $0.40 Other Cash Revenue $18,832 $19,160 $18,922 $18,687 $18.454 Adjustment Factor on Com Yield 100.0% Table A3. Crop assessment cash flows Year Salvage Value 1 2 3 4 5 UN Cash Revenue $42,032 42,360 42,122 41,887 41,654 Cash Expense $20,301 20,910 21,242 21,583 21,932 Taxes $5,590 3,777 4,139 4,413 15,054 Net After Tax Cash Flow $16,141 17,673 16,741 15,891 34,669 30,000 store, it will be sold at the market price, which he estimates will be about $1.90 per bushel. While the premium for the food grade corn is 40 a bushel, Craig knows it will cost more to manage and store the crop. Looking at his costs, he figures that he will receive a net 18 a bushel for the food grade corn over commodity corn, plus about another $22 for storing the product for sale later in the year. Table A3 shows the cash flows that Craig has developed for his five-year planning horizon. (pre-tax cost of debt) Numbers to be used in calculating the weighted cost of capital Marginal tax rate 35.0% Cost of Debt 8.3% After Tax Cost of Equity 8.0% Weighted amount of debt (long run) 20.0% Weighted amount of equity (long run) 80.0% NOTE: You will need to complete the tables below. To do so, equations will need to be entered into the shaded cells below. Total Cash Revenue is just the sum of the primary source of cash revenue for the particular investment and its other cash revenue. To properly incorporate the risk analysis, be sure to multiply the milk price and the corn yield by its associated adjustment factor. Use that adjusted cell when calculating the cash revenue cell. Net Cash Flow Milk Cash Revenue Table A2. Dairy assessment cash flows Total Cash Total Cash Year Revenue Expense Salvage Value 1 $882,700 2 2 $914,629 3 $821,761 4 $876,264 5 $932,980 6 $956,304 7 $1,016,783 8 $1,042,202 9 $1,106,680 10 $1,134,347 $835,000 Total initial investment - $1,700,000 Taxes already account for depreciation expense. Taxes $13,044 ($54,294) $19,129 $31,966 $37,547 $51,435 $70,385 $64,740 $64,071 $351,565 Cash Revenue Projections for Milk Expansion Milk Price ($ per cwt, Year including $1 premium) Adjusted Milk Price 1 $13.60 2 $12.80 3 $13.50 4 $13.70 5 $13.80 6 $13.90 7 $14.00 8 $14.10 9 $14.30 10 $14.40 Milk Production per Cow per Year (cwt) 200 205 210 220 230 230 240 240 250 250 New Cows 350 350 350 350 350 350 350 350 350 350 Other Cash Revenue $141,219 $144,345 $120,416 $122,865 $126,085 $128,560 $133,652 $134,544 $130,258 $135,588 Adjustment Factor on Milk Price 100.0% Adjusted Com Yield (BushelAcre) Food Grade Com Cash Revenue Net Cash Flow Table A3. Crop assessment cash flows Total Cash Total Cash Year Revenue Expense Salvage Value 1 1 $20,301 2 $20,910 3 $21,242 4 $21,583 5 $21,932 $30,000 Total initial investment - $76,800 Taxes already account for depreciation expense. Taxes $5,590 $3,777 $4,139 $4,413 $15,054 Cash Revenue Projections for Food Grade Com Expansion New Food-grade Com Year Acres Com Yield (BushelAcre 1 400 145 2 400 145 3 400 145 4 400 145 5 400 145 Food Grade Com Premium ($/Bushel) $0.40 $0.40 $0.40 $0.40 $0.40 Other Cash Revenue $18,832 $19,160 $18,922 $18,687 $18.454 Adjustment Factor on Com Yield 100.0% Table A3. Crop assessment cash flows Year Salvage Value 1 2 3 4 5 UN Cash Revenue $42,032 42,360 42,122 41,887 41,654 Cash Expense $20,301 20,910 21,242 21,583 21,932 Taxes $5,590 3,777 4,139 4,413 15,054 Net After Tax Cash Flow $16,141 17,673 16,741 15,891 34,669 30,000 store, it will be sold at the market price, which he estimates will be about $1.90 per bushel. While the premium for the food grade corn is 40 a bushel, Craig knows it will cost more to manage and store the crop. Looking at his costs, he figures that he will receive a net 18 a bushel for the food grade corn over commodity corn, plus about another $22 for storing the product for sale later in the year. Table A3 shows the cash flows that Craig has developed for his five-year planning horizon