please only use r for this
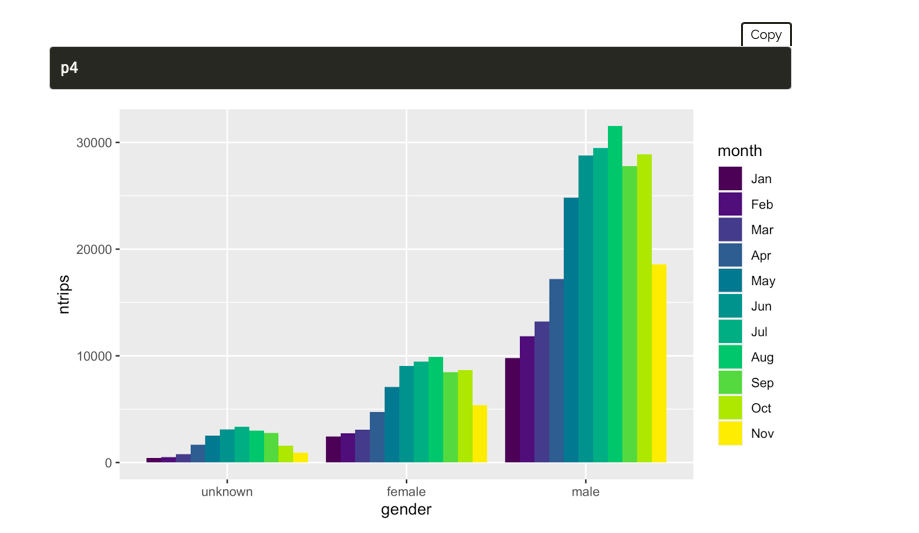
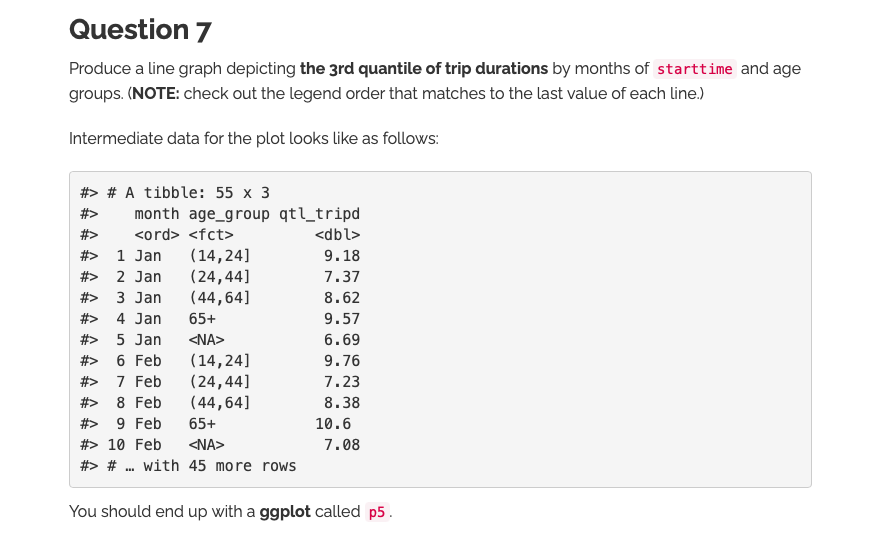
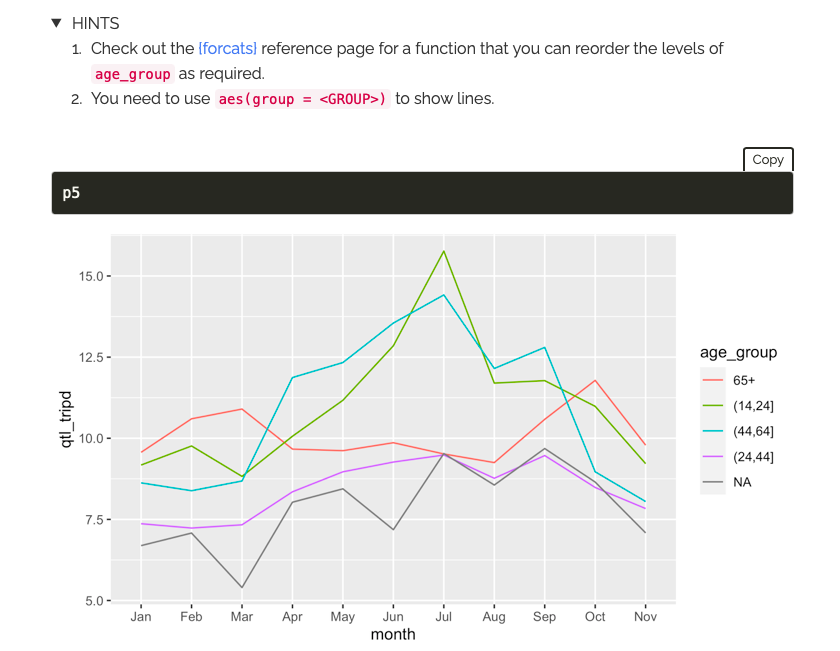
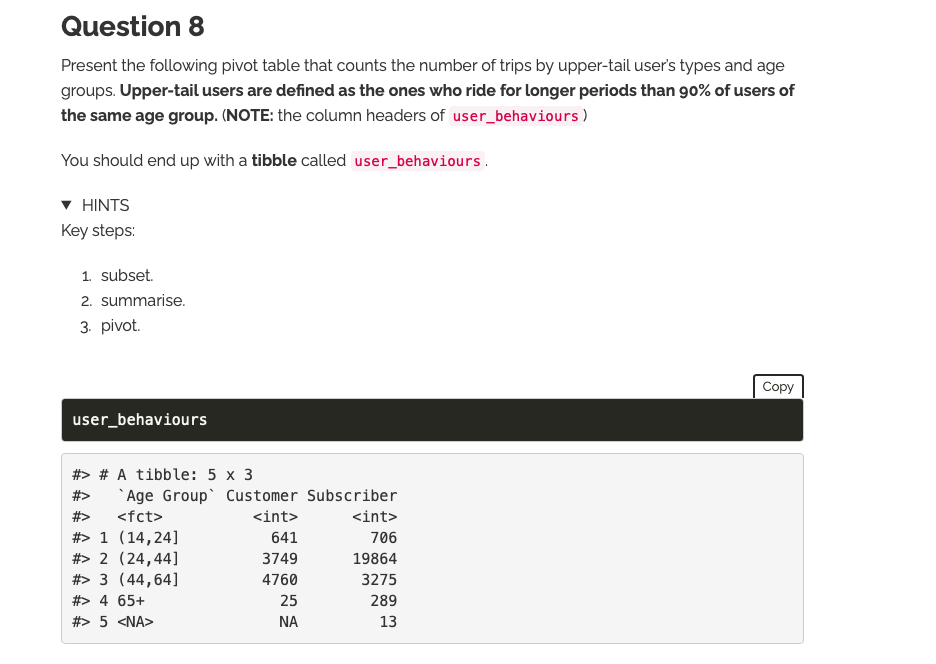
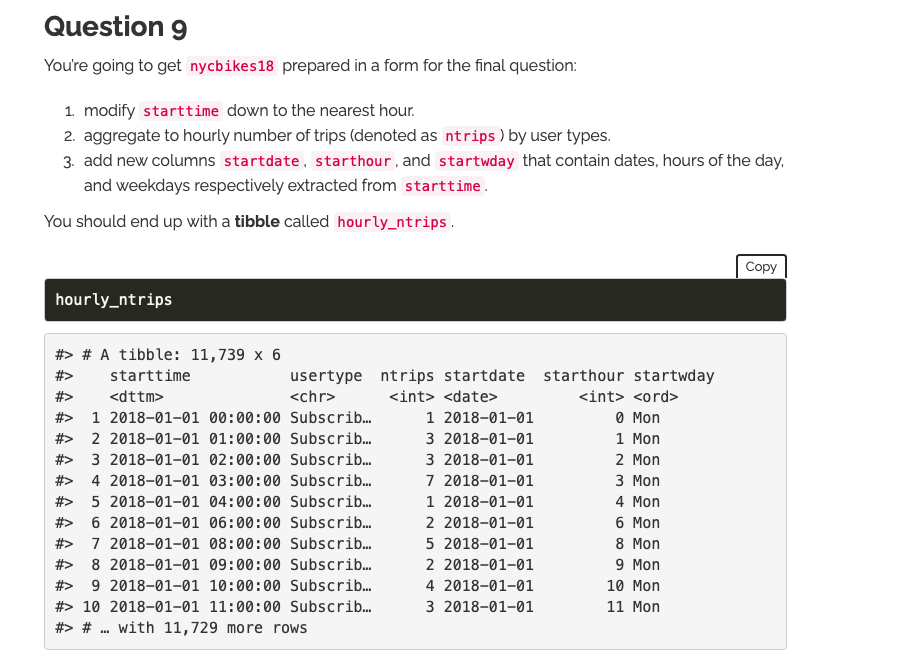
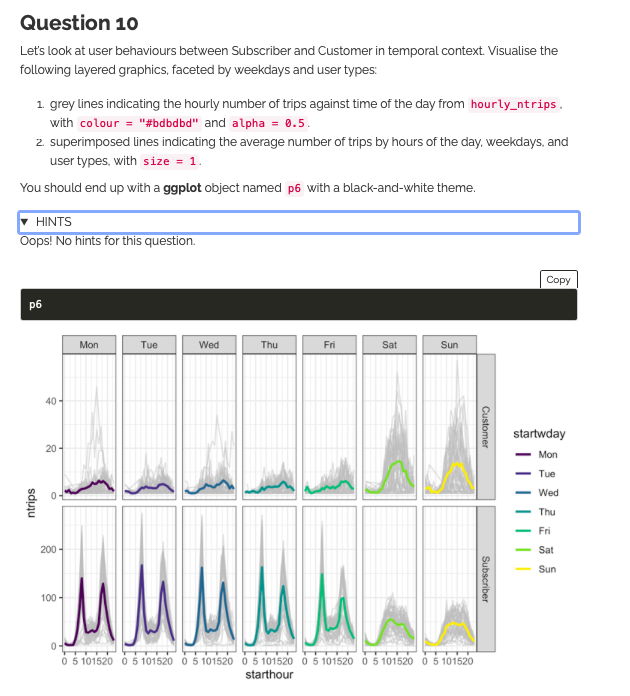
Age Group Question 6 Plot a grouped bar chart that sums up the number of trips by months of startime and gender. Intermediate data for the plot looks like as follows: #> # A tibble: 33 x 3 #> month gender ntrips #>
#> 1 Jan unknown 428 #> 2 Jan male 9798 #> 3 Jan female 2451 #> 4 Feb unknown 498 #> 5 Feb male 11849 #> 6 Feb female 2757 #> 7 Mar unknown 794 #> 8 Mar male 13231 #> 9 Mar female 3084 #> 10 Apr unknown 1676 #> # .. with 23 more rows You should end up with a ggplot called p4. HINTS Key steps: 1. extract months of starttime . 2. modify gender .Copy p4 30000 - month Jan Feb Mar 20000 - Apr May ntrips Jun Jul 10000 - Aug Sep Oct Nov 0 - unknown female male genderQuestion 7 Produce a line graph depicting the 3rd quantile of trip durations by months of starttime and age groups. (NOTE: check out the legend order that matches to the last value of each line.) Intermediate data for the plot looks like as follows: #> # A tibble: 55 x 3 #> month age_group qtl_tripd #> #> 1 Jan (14,24] 9. 18 #> 2 Jan (24,44] 7.37 #> 3 Jan (44, 64] 8. 62 4 Jan 65+ 9.57 #> 5 Jan 6.69 #> 6 Feb (14,24] 9. 76 #> 7 Feb (24,44] 7.23 #> 8 Feb (44,64] 8. 38 #> 9 Feb 65+ 10.6 #> 10 Feb 7. 08 #> # .. with 45 more rows You should end up with a ggplot called p5.HINTS 1. Check out the [forcats) reference page for a function that you can reorder the levels of age_group as required. 2. You need to use aes (group = ) to show lines. Copy p5 15.0 - 12.5 - age_group 65+ (14,24] qtl_tripd - 10.0- (44.64] (24,44] NA 7.5- 5.0- Jan Feb Mar Apr May Jun Jul Aug Sep Oct Nov monthQuestion 8 Present the following pivot table that counts the number of trips by upper-tail user's types and age groups. Upper-tail users are defined as the ones who ride for longer periods than 90% of users of the same age group. (NOTE: the column headers of user_behaviours ) You should end up with a tibble called user_behaviours . HINTS Key steps: 1 subset. 2. summarise. 3. pivot. Copy user_behaviours #> # A tibble: 5 x 3 #> *Age Group Customer Subscriber #> #> 1 (14,24] 641 706 #> 2 (24,44] 3749 19864 #> 3 (44,64] 4760 3275 #> 4 65+ 25 289 #> 5 NA 13Question 9 You're going to get nycbikes18 prepared in a form for the final question: 1. modify starttime down to the nearest hour. 2. aggregate to hourly number of trips (denoted as ntrips ) by user types. 3. add new columns startdate, starthour , and startwday that contain dates, hours of the day, and weekdays respectively extracted from starttime. You should end up with a tibble called hourly_ntrips . Copy hourly_ntrips #> # A tibble: 11, 739 x 6 #> starttime usertype ntrips startdate starthour startwday #> #> 1 2018-01-01 00:00:00 Subscribe. 1 2018-01-01 0 Mon #> 2 2018-01-01 01:00:00 Subscribe. 3 2018-01-01 1 Mon #> 3 2018-01-01 02:00:00 Subscribe. 3 2018-01-01 2 Mon #> 4 2018-01-01 03:00:00 Subscribe. 7 2018-01-01 3 Mon #> 5 2018-01-01 04:00:00 Subscribe. 1 2018-01-01 4 Mon #> 6 2018-01-01 06:00:00 Subscribe. 2 2018-01-01 6 Mon #> 7 2018-01-01 08:00:00 Subscribe. 5 2018-01-01 8 Mon #> 8 2018-01-01 09:00:00 Subscribe. 2 2018-01-01 9 Mon #> 9 2018-01-01 10:00:00 Subscribe. 4 2018-01-01 10 Mon #> 10 2018-01-01 11:00:00 Subscribe. 3 2018-01-01 11 Mon #> # .. with 11, 729 more rowsQuestion 10 Let's look at user behaviours between Subscriber and Customer in temporal context. Visualise the following layered graphics, faceted by weekdays and user types: 1. grey lines indicating the hourly number of trips against time of the day from hourly_ntrips. with colour = "#bdbdbd" and alpha = 0.5. 2. superimposed lines indicating the average number of trips by hours of the day, weekdays, and user types, with size = 1. You should end up with a ggplot object named p6 with a black-and-white theme. HINTS Oops! No hints for this question. Copy p6 Mon Tue Wed Thu Fri Sat Sun 40- Customer startwday 20 - Mon Tue Wed ntrips Thu Fri 200 - Sa - Sun MUMMMAA Subscriber 0 5 101520 0 6 101520 0 5 101520 0 5 101520 0 5 101520 0 5 101520 0 5 101520 starthour