please organize the answers and make it clear
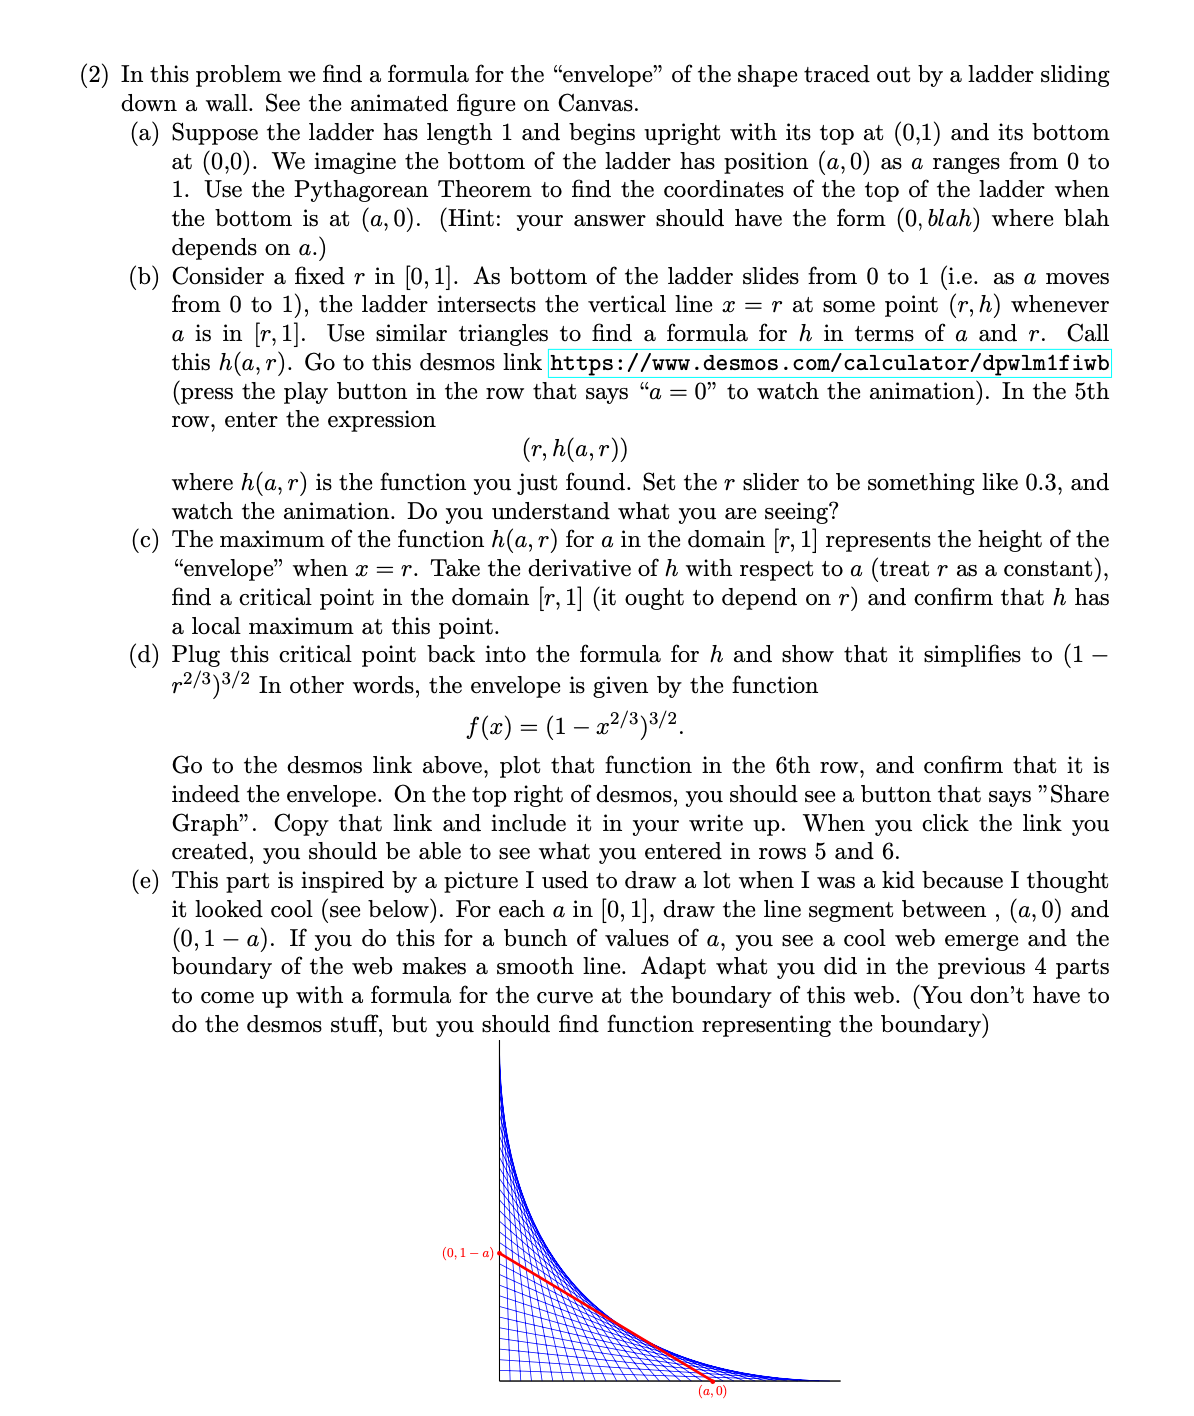
(2) In this problem we nd a formula for the \"envelope\" of the shape traced out by a ladder sliding down a wall. See the animated gure on Canvas. (8-) ('3) Suppose the ladder has length 1 and begins upright with its top at (0,1) and its bottom at (0,0). We imagine the bottom of the ladder has position (a, 0) as a ranges from 0 to 1. Use the Pythagorean Theorem to nd the coordinates of the top of the ladder when the bottom is at (3,0). (Hint: your answer should have the form (0, blah) where blah depends on 0;.) Consider a xed 1' in [0,1]. As bottom of the ladder slides from 0 to 1 (i.e. as 0. moves from 0 to 1), the ladder intersects the vertical line :5 = r at some point (r,h) whenever a is in [1", 1]. Use similar triangles to nd a formula for h in terms of a and 1". Call this h(a, 1"). Go to this desmos link https: //ww.desmos .com/calculator/dpwlmlf iwb (press the play button in the row that says \"a : 0\" to watch the animation). In the 5th row, enter the expression (a MS: 1" where Ma, r) is the function you just found. Set the r slider to be something like 0.3, and watch the animation. Do you understand what you are seeing? The maximum of the function Ma, r) for o, in the domain [13 1] represents the height of the \"envelope\" when a: = r. Take the derivative of h with respect to a (treat 1" as a constant), nd a critical point in the domain [r, 1] (it ought to depend on r) and conrm that I; has a local maximum at this point. Plug this critical point back into the formula for h and show that it simplies to (1 r2/3)3(2 In other words, the envelope is given by the function f(x) = (1 WW. Go to the desmos ]ink above, plot that function in the 6th row, and conrm that it is indeed the envelope. 0n the top right of desmos, you should see a button that says \"Share Graph\". Copy that link and include it in your write up. When you click the link you created, you should be able to see what you entered in rows 5 and 6. This part is inspired by a picture I used to draw a lot when I was a kid because I thought it looked cool (see below). For each a. in [0, 1], draw the line segment between , (c, 0) and (0,1 a). If you do this for a bunch of values of a, you see a cool web emerge and the boundary of the web makes a smooth line. Adapt what you did in the previous 4 parts to come up with a formula for the curve at the boundary of this web. (You don't have to do the desmos stu, but you should nd function representing the boundary)


