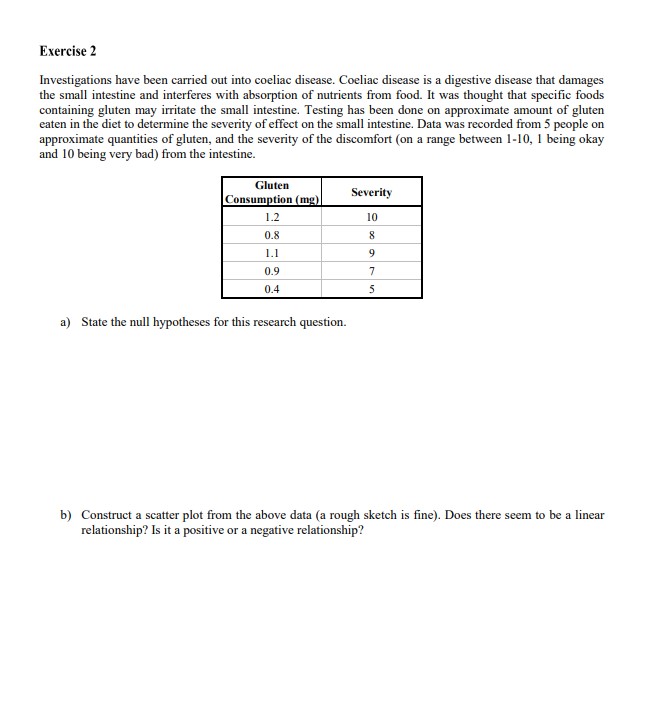
Please outline steps to solve each step. and show solution.
Exercise 2 Investigations have been carried out into coeliac disease. Coeliac disease is a digestive disease that damages the small intestine and interferes with absorption of nutrients from food. It was thought that specific foods containing gluten may irritate the small intestine. Testing has been done on approximate amount of gluten eaten in the diet to determine the severity of effect on the small intestine. Data was recorded from 5 people on approximate quantities of gluten, and the severity of the discomfort (on a range between 1-10, 1 being okay and 10 being very bad) from the intestine. Gluten Severity Consumption (mg) 1.2 0.8 8 1.1 9 0.9 7 0.4 a) State the null hypotheses for this research question. b) Construct a scatter plot from the above data (a rough sketch is fine). Does there seem to be a linear relationship? Is it a positive or a negative relationship?c) Determine, using the appropriate equation, Pearson's Correlation Coefficient. d) Based on your assessment of the correlation coefficient, how useful would the regression model be? e) Is the correlation significant? If it is, determine the equation of the regression line.f) Are there any limitations to the feasibility of the linear model established in part (e)? For example, what are the valid and realistic/practical domain and ranges for the model? g) What is the coefficient of determination for this data? Explain what it means. h) Using the linear model determined in question (e), make a prediction of the severity of discomfort if 0.5 mg of gluten were consumed. i) Fill in the blanks for this SPSS output. Coefficients Standardized Unstandardized Coefficients Coefficients Model B Std. Error Beta Sig. (Constant) 1.013 2.595 -081 Gluten consumption (mg) 1.09% N/A (you can't calculate this manually) a. Dependent Variable: Severity of discomfort