

Answered step by step
Verified Expert Solution
Question
1 Approved Answer
Please perform a sensitivity analysis using this information regarding worldwide paper company. Exhibit 2 Worldwide Paper Company New Woodyard Project Assumptions: Capital outlay (2016) Capital
Please perform a sensitivity analysis using this information regarding worldwide paper company.
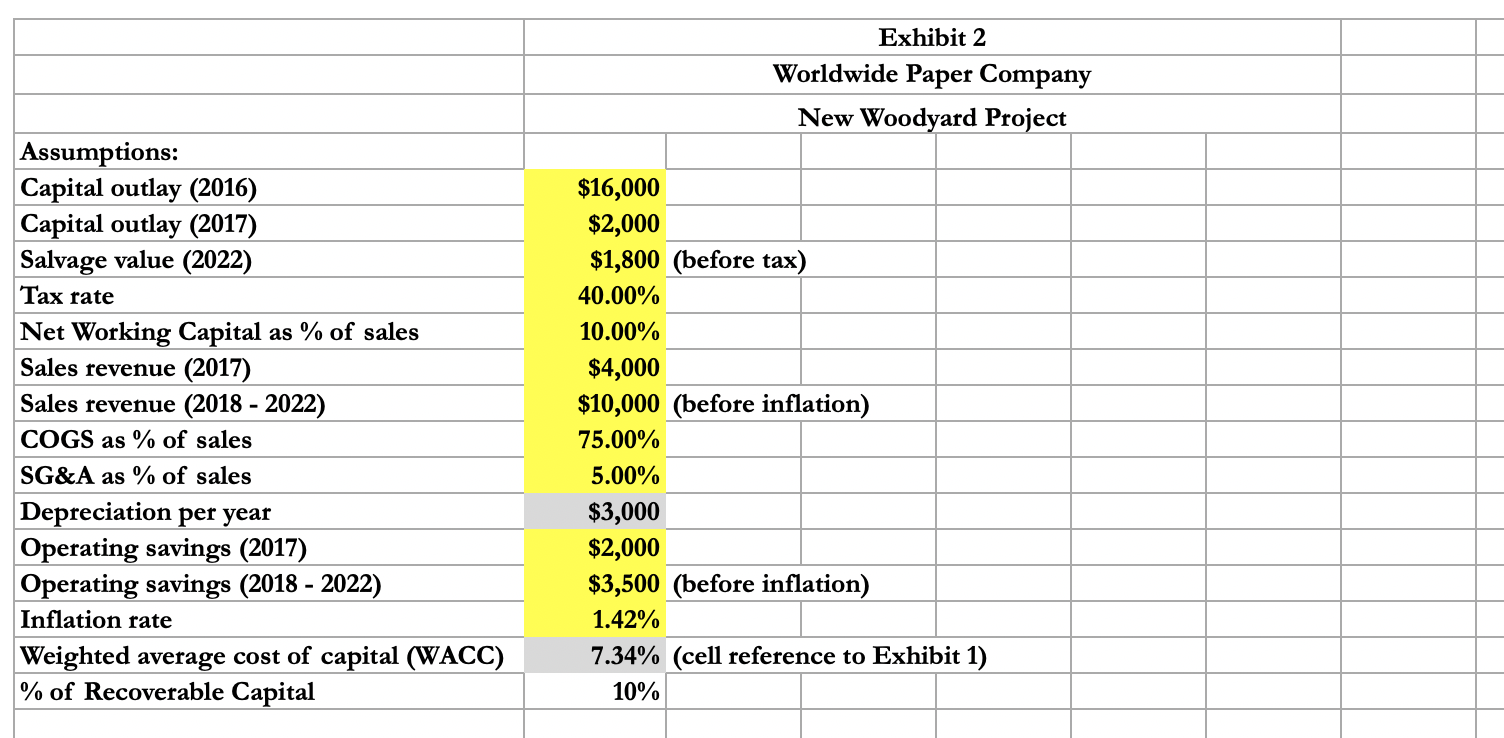
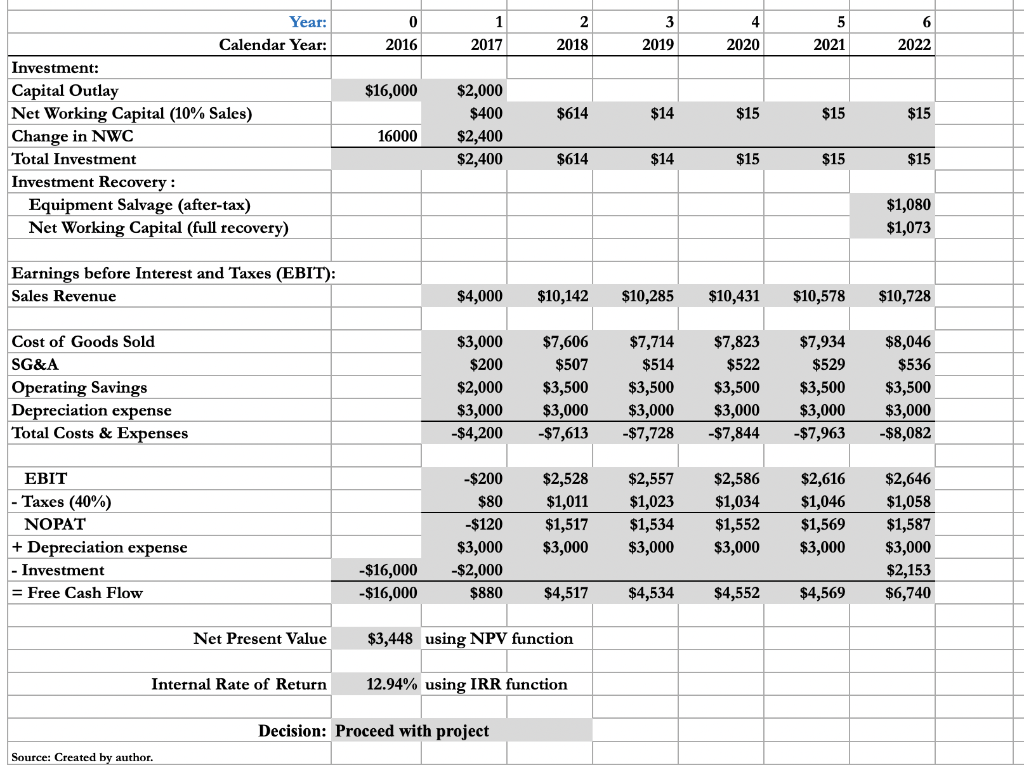
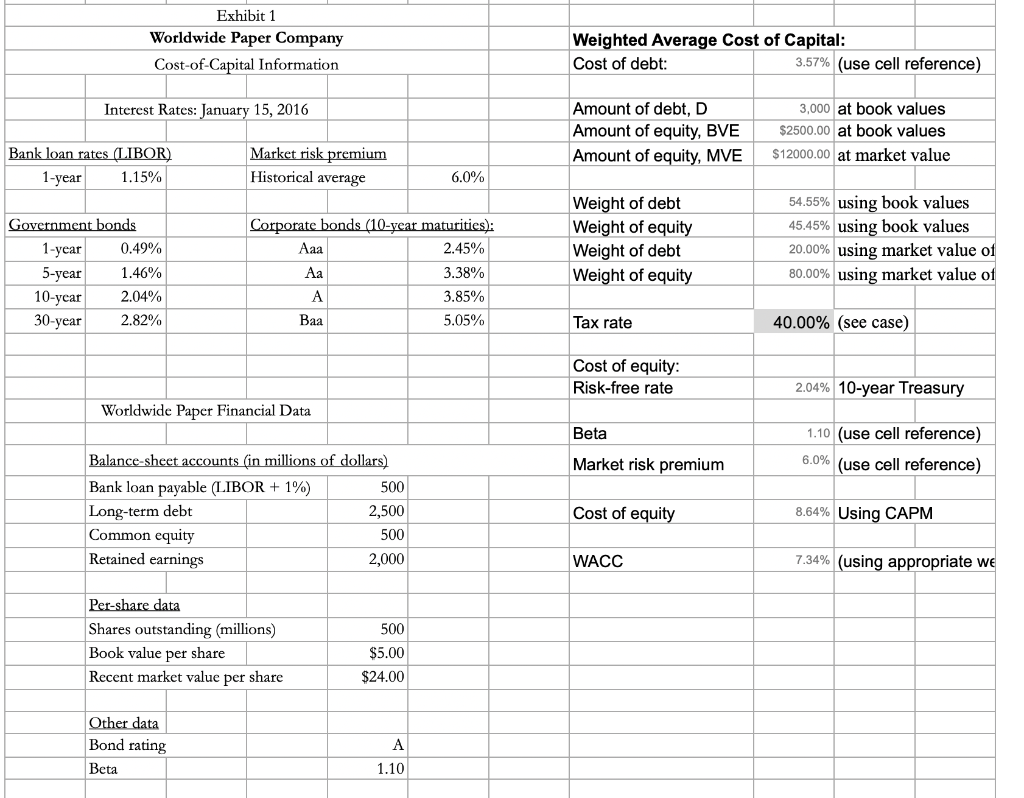
Exhibit 2 Worldwide Paper Company New Woodyard Project Assumptions: Capital outlay (2016) Capital outlay (2017) Salvage value (2022) Tax rate Net Working Capital as % of sales Sales revenue (2017) Sales revenue (2018 - 2022) COGS as % of sales SG&A as % of sales Depreciation per year Operating savings (2017) Operating savings (2018 - 2022) Inflation rate Weighted average cost of capital (WACC) % of Recoverable Capital $16,000 $2,000 $1,800 (before tax) 40.00% 10.00% $4,000 $10,000 (before inflation) 75.00% 5.00% $3,000 $2,000 $3,500 (before inflation) 1.42% 7.34% (cell reference to Exhibit 1) 10% 0 23 2018 2019 4 2020 5 2021 6 2022 2016 2017 $16,000 $614 $14 $15 $15 $15 Year: Calendar Year: Investment: Capital Outlay Net Working Capital (10% Sales) Change in NWC Total Investment Investment Recovery: Equipment Salvage (after-tax) Net Working Capital (full recovery) $2,000 $400 $2,400 $2,400 16000 $614 $14 $15 $15 $15 $1,080 $1,073 Earnings before Interest and Taxes (EBIT): Sales Revenue $4,000 $10,142 $10,285 $10,431 $10,578 $10,728 Cost of Goods Sold SG&A Operating Savings Depreciation expense Total Costs & Expenses $3,000 $200 $2,000 $3,000 -$4,200 $7,606 $507 $3,500 $3,000 $7,613 $7,714 $514 $3,500 $3,000 -$7,728 $7,823 $522 $3,500 $3,000 $7,844 $7,934 $529 $3,500 $3,000 -$7,963 $8,046 $536 $3,500 $3,000 -$8,082 EBIT - Taxes (40%) NOPAT + Depreciation expense - Investment = Free Cash Flow -$200 $80 -$120 $3,000 -$2,000 $880 $2,528 $1,011 $1,517 $3,000 $2,557 $1,023 $1,534 $3,000 $2,586 $1,034 $1,552 $2,616 $1,046 $1,569 $3,000 $2,646 $1,058 $1,587 $3,000 $2,153 $6,740 -$16,000 -$16,000 $4,517 $4,534 $4,552 $4,569 Net Present Value $3,448 using NPV function Internal Rate of Return 12.94% using IRR function Decision: Proceed with project Source: Created by author. Exhibit 1 Worldwide Paper Company Cost-of-Capital Information Weighted Average Cost of Capital: Cost of debt: 3.57% (use cell reference) Interest Rates: January 15, 2016 Amount of debt, D Amount of equity, BVE Amount of equity, MVE 3,000 at book values $2500.00 at book values $12000.00 at market value Bank loan rates (LIBOR) 1-year 1.15% Market risk premium Historical average 6.0% Government bonds 1-year 0.49% 5-year 1.46% 10-year 2.04% 30-year 2.82% Corporate bonds (10-year maturities): Aaa 2.45% 3.38% A 3.85% 5.05% Weight of debt Weight of equity Weight of debt Weight of equity 54.55% using book values 45.45% using book values 20.00% using market value of 80.00% using market value of Baa Tax rate 40.00% (see case) Cost of equity Risk-free rate 2.04% 10-year Treasury Worldwide Paper Financial Data Beta 1.10 (use cell reference) 6.0% (use cell reference) Market risk premium Balance sheet accounts (in millions of dollars) Bank loan payable (LIBOR + 1% 500 Long-term debt 2,500 Common equity 500 Retained earnings 2,000 Cost of equity 8.64% Using CAPM WACC 7.34% (using appropriate we Per-share data Shares outstanding (millions) Book value per share Recent market value per share 500 $5.00 $24.00 Other data Bond rating Beta 1.10 Exhibit 2 Worldwide Paper Company New Woodyard Project Assumptions: Capital outlay (2016) Capital outlay (2017) Salvage value (2022) Tax rate Net Working Capital as % of sales Sales revenue (2017) Sales revenue (2018 - 2022) COGS as % of sales SG&A as % of sales Depreciation per year Operating savings (2017) Operating savings (2018 - 2022) Inflation rate Weighted average cost of capital (WACC) % of Recoverable Capital $16,000 $2,000 $1,800 (before tax) 40.00% 10.00% $4,000 $10,000 (before inflation) 75.00% 5.00% $3,000 $2,000 $3,500 (before inflation) 1.42% 7.34% (cell reference to Exhibit 1) 10% 0 23 2018 2019 4 2020 5 2021 6 2022 2016 2017 $16,000 $614 $14 $15 $15 $15 Year: Calendar Year: Investment: Capital Outlay Net Working Capital (10% Sales) Change in NWC Total Investment Investment Recovery: Equipment Salvage (after-tax) Net Working Capital (full recovery) $2,000 $400 $2,400 $2,400 16000 $614 $14 $15 $15 $15 $1,080 $1,073 Earnings before Interest and Taxes (EBIT): Sales Revenue $4,000 $10,142 $10,285 $10,431 $10,578 $10,728 Cost of Goods Sold SG&A Operating Savings Depreciation expense Total Costs & Expenses $3,000 $200 $2,000 $3,000 -$4,200 $7,606 $507 $3,500 $3,000 $7,613 $7,714 $514 $3,500 $3,000 -$7,728 $7,823 $522 $3,500 $3,000 $7,844 $7,934 $529 $3,500 $3,000 -$7,963 $8,046 $536 $3,500 $3,000 -$8,082 EBIT - Taxes (40%) NOPAT + Depreciation expense - Investment = Free Cash Flow -$200 $80 -$120 $3,000 -$2,000 $880 $2,528 $1,011 $1,517 $3,000 $2,557 $1,023 $1,534 $3,000 $2,586 $1,034 $1,552 $2,616 $1,046 $1,569 $3,000 $2,646 $1,058 $1,587 $3,000 $2,153 $6,740 -$16,000 -$16,000 $4,517 $4,534 $4,552 $4,569 Net Present Value $3,448 using NPV function Internal Rate of Return 12.94% using IRR function Decision: Proceed with project Source: Created by author. Exhibit 1 Worldwide Paper Company Cost-of-Capital Information Weighted Average Cost of Capital: Cost of debt: 3.57% (use cell reference) Interest Rates: January 15, 2016 Amount of debt, D Amount of equity, BVE Amount of equity, MVE 3,000 at book values $2500.00 at book values $12000.00 at market value Bank loan rates (LIBOR) 1-year 1.15% Market risk premium Historical average 6.0% Government bonds 1-year 0.49% 5-year 1.46% 10-year 2.04% 30-year 2.82% Corporate bonds (10-year maturities): Aaa 2.45% 3.38% A 3.85% 5.05% Weight of debt Weight of equity Weight of debt Weight of equity 54.55% using book values 45.45% using book values 20.00% using market value of 80.00% using market value of Baa Tax rate 40.00% (see case) Cost of equity Risk-free rate 2.04% 10-year Treasury Worldwide Paper Financial Data Beta 1.10 (use cell reference) 6.0% (use cell reference) Market risk premium Balance sheet accounts (in millions of dollars) Bank loan payable (LIBOR + 1% 500 Long-term debt 2,500 Common equity 500 Retained earnings 2,000 Cost of equity 8.64% Using CAPM WACC 7.34% (using appropriate we Per-share data Shares outstanding (millions) Book value per share Recent market value per share 500 $5.00 $24.00 Other data Bond rating Beta 1.10Step by Step Solution
There are 3 Steps involved in it
Step: 1

Get Instant Access to Expert-Tailored Solutions
See step-by-step solutions with expert insights and AI powered tools for academic success
Step: 2

Step: 3
Ace Your Homework with AI
Get the answers you need in no time with our AI-driven, step-by-step assistance
Get Started
The Emotion Behind Money Building Wealth From The Inside Out
Authors: Julie M. Murphy
1st Edition
979-8598954188