

Question: Please perform the following using matlab The file seamount.mat contains data measurements of a mountain under the sea. Variable x in seamount represents latitude in
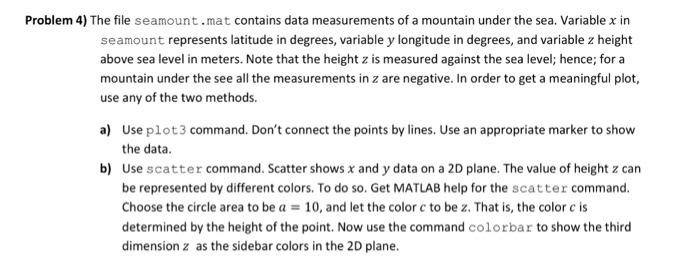
The file seamount.mat contains data measurements of a mountain under the sea. Variable x in seamount represents latitude in degrees, variable y longitude in degrees, and variable z height above sea level in meters. Note that the height z is measured against the sea level; hence; for a mountain under the see all the measurements in z are negative. In order to get a meaningful plot, use any of the two methods. a) Use plot 3 command. Don't connect the points by lines. Use an appropriate marker to show the data. b) Use scatter command. Scatter shows x and y data on a 2D plane. The value of height z can be represented by different colors. To do so. Get MATLAB help for the scatter command. Choose the circle area to be a = 10, and let the color c to be z. That is, the color c is determined by the height of the point. Now use the command colorbar to show the third dimension z as the sidebar colors in the 2D plane. The file seamount.mat contains data measurements of a mountain under the sea. Variable x in seamount represents latitude in degrees, variable y longitude in degrees, and variable z height above sea level in meters. Note that the height z is measured against the sea level; hence; for a mountain under the see all the measurements in z are negative. In order to get a meaningful plot, use any of the two methods. a) Use plot 3 command. Don't connect the points by lines. Use an appropriate marker to show the data. b) Use scatter command. Scatter shows x and y data on a 2D plane. The value of height z can be represented by different colors. To do so. Get MATLAB help for the scatter command. Choose the circle area to be a = 10, and let the color c to be z. That is, the color c is determined by the height of the point. Now use the command colorbar to show the third dimension z as the sidebar colors in the 2D plane
Step by Step Solution
There are 3 Steps involved in it

Get step-by-step solutions from verified subject matter experts