Answered step by step
Verified Expert Solution
Question
1 Approved Answer
Please !!,please help me explain and write (answer in detail with paragraphs )! I superb appreciate your time and help. Your proposal is as follows:
Please !!,please help me explain and write (answer in detail with paragraphs )! I superb appreciate your time and help.
Your proposal is as follows:
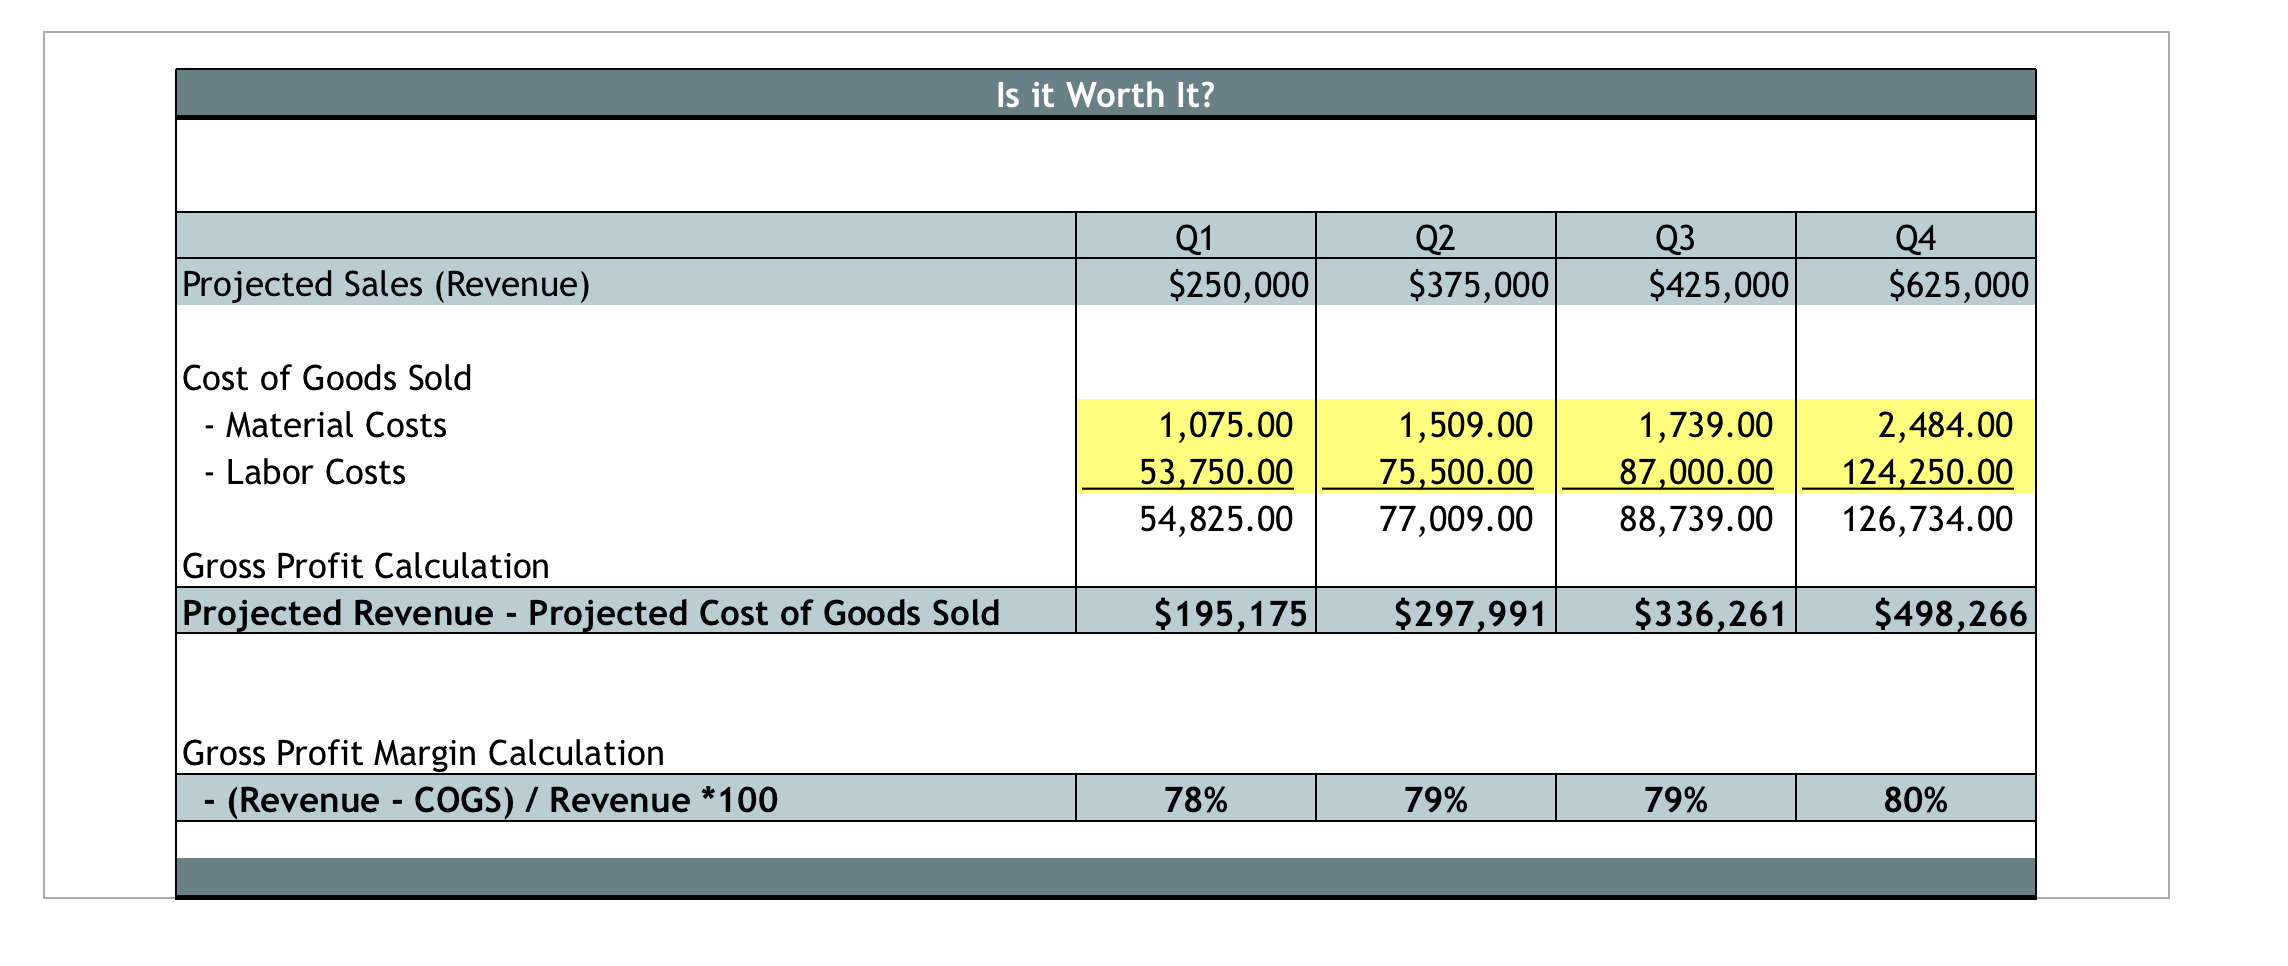
We can produce 62,000 mice in the first quarter of the year and add $1,550,000 in revenue!
- Sales Forecast What was your initial sales forecast?
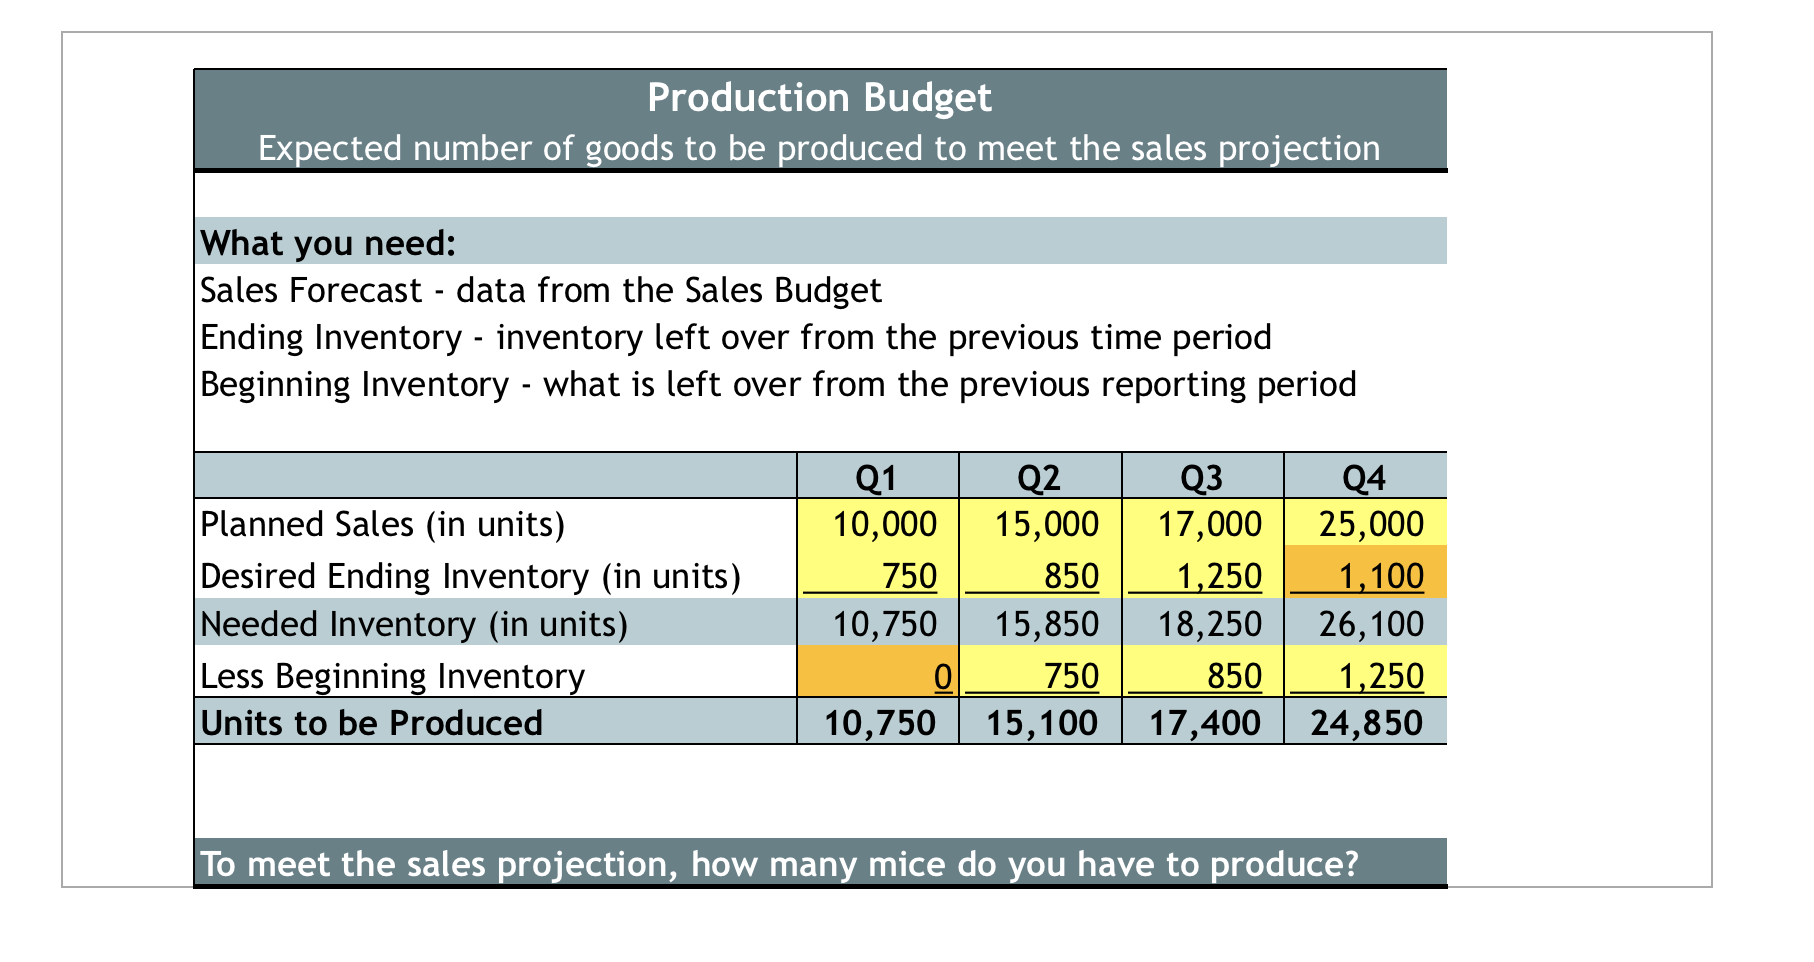
- Production Forecast After completing the Production budget, inform your boss of the results. Discuss how you arrived at your results.
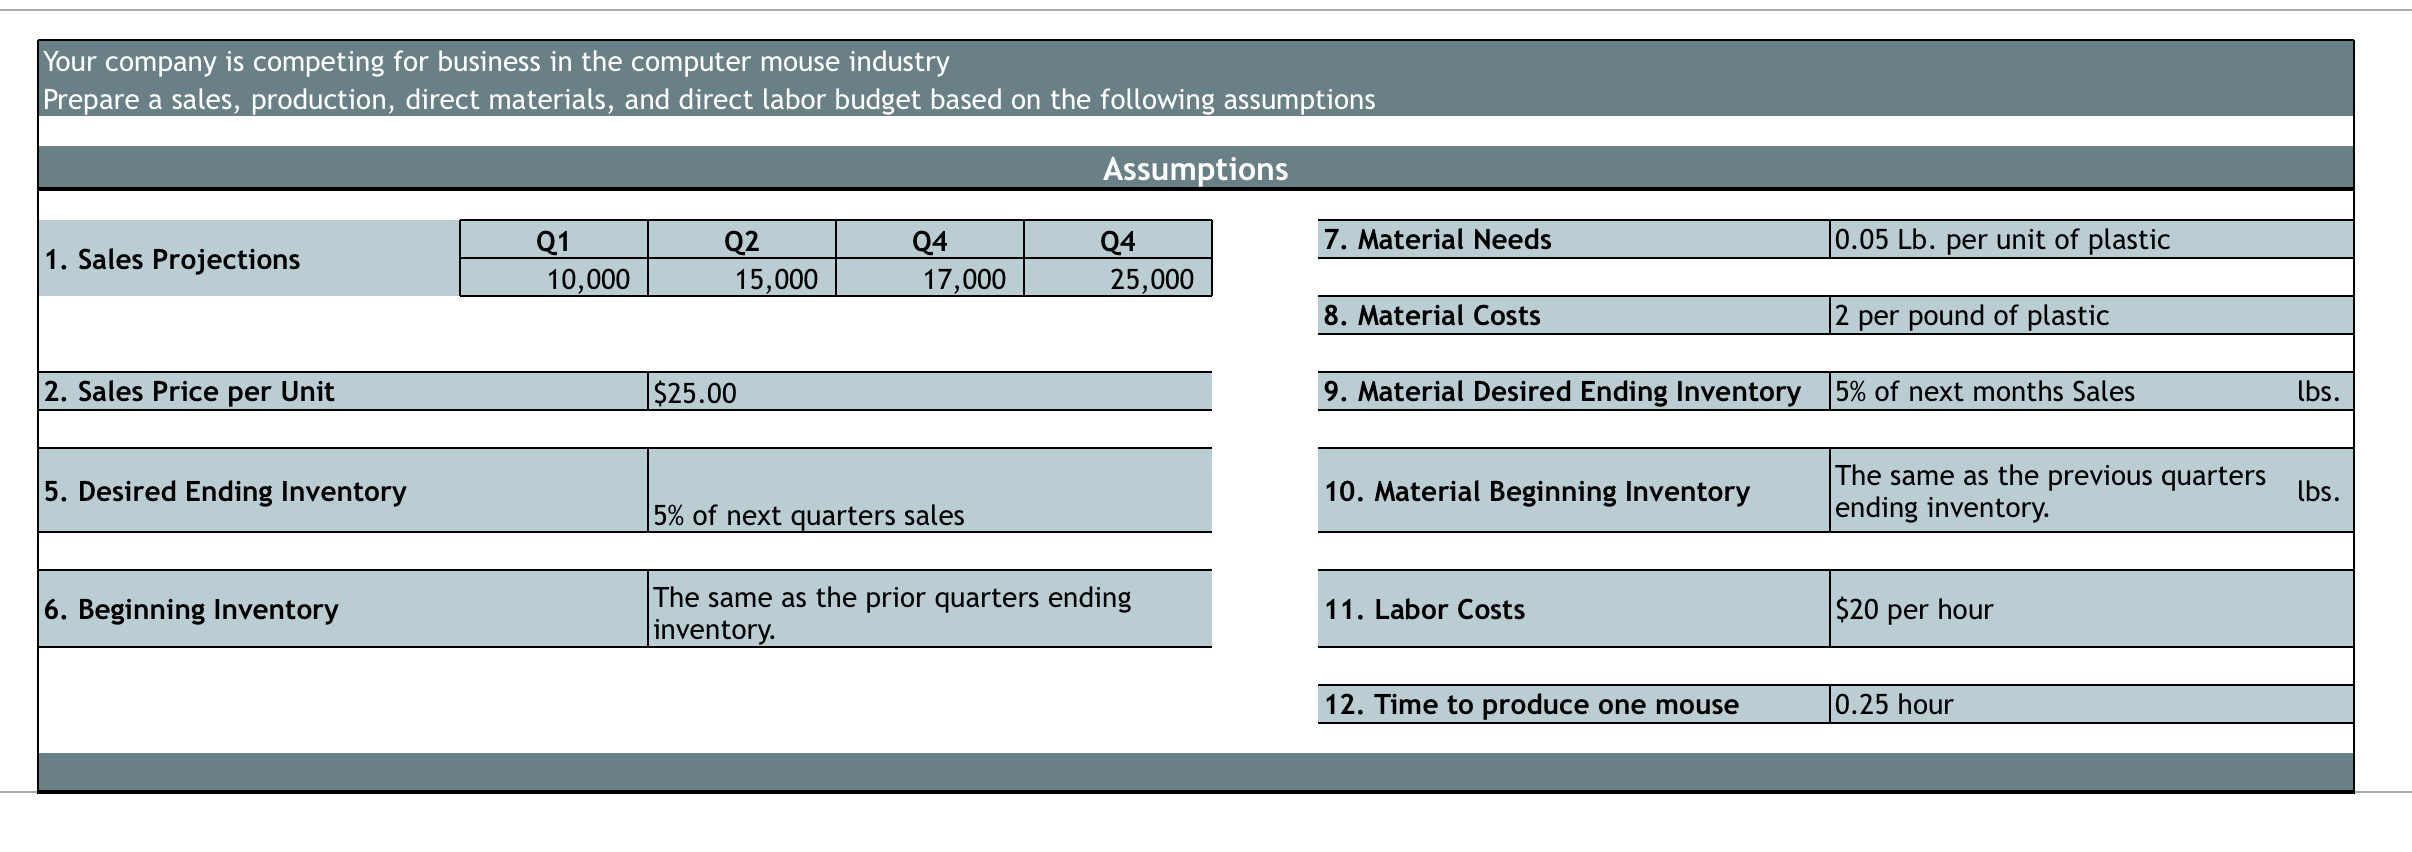
Your company is competing for business in the computer mouse industry Prepare a sales, production, direct materials, and direct labor budget based on the following assumptions Assumptions Q2 1. Sales Projections Q1 10,000 Q4 17,000 Q4 25,000 2. Sales Price per Unit 5. Desired Ending Inventory 6. Beginning Inventory 15,000 $25.00 |5% of next quarters sales The same as the prior quarters ending inventory. 7. Material Needs 8. Material Costs 9. Material Desired Ending Inventory 10. Material Beginning Inventory 11. Labor Costs 12. Time to produce one mouse 0.05 Lb. per unit of plastic 2 per pound of plastic 5% of next months Sales The same as the previous quarters ending inventory. $20 per hour 0.25 hour lbs. lbs. Units Sales Price Total Sales Sales Budget Expected Sales in Units Q1 Q2 Q3 17,000 10,000 15,000 $25 $25 $25 $250,000 $375,000 $425,000 Q4 25,000 $25 $625,000 Production Budget Expected number of goods to be produced to meet the sales projection What you need: Sales Forecast - data from the Sales Budget Ending Inventory - inventory left over from the previous time period Beginning Inventory - what is left over from the previous reporting period Q1 Q2 Q3 Q4 25,000 Planned Sales (in units) 10,000 15,000 17,000 Desired Ending Inventory (in units) 750 850 1,250 1,100 Needed Inventory (in units) 10,750 15,850 18,250 26,100 Less Beginning Inventory 750 850 1,250 Units to be Produced 10,750 15,100 17,400 24,850 To meet the sales projection, how many mice do you have to produce? 0 Is it Worth It? Projected Sales (Revenue) Cost of Goods Sold - Material Costs - Labor Costs Gross Profit Calculation Projected Revenue - Projected Cost of Goods Sold Gross Profit Margin Calculation - (Revenue - COGS) / Revenue *100 Q1 $250,000 Q2 $375,000 1,075.00 1,509.00 53,750.00 75,500.00 54,825.00 77,009.00 $195,175 $297,991 78% 79% Q3 $425,000 1,739.00 2,484.00 87,000.00 124,250.00 88,739.00 126,734.00 $336,261 79% Q4 $625,000 $498,266 80%
Step by Step Solution
There are 3 Steps involved in it
Step: 1
Get Instant Access to Expert-Tailored Solutions
See step-by-step solutions with expert insights and AI powered tools for academic success
Step: 2
Step: 3
Ace Your Homework with AI
Get the answers you need in no time with our AI-driven, step-by-step assistance
Get Started