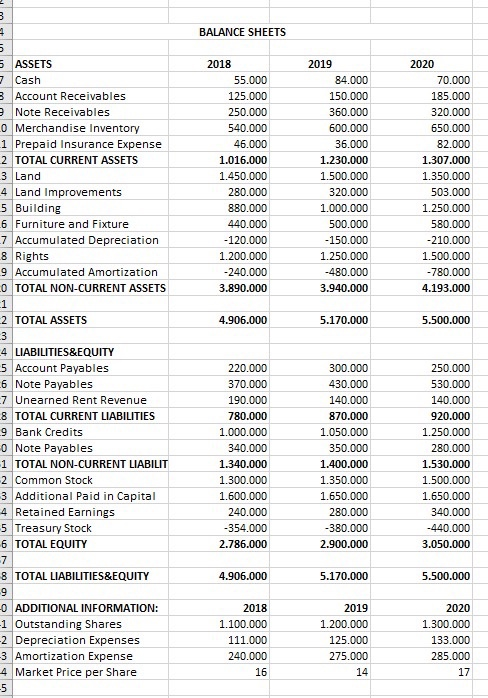
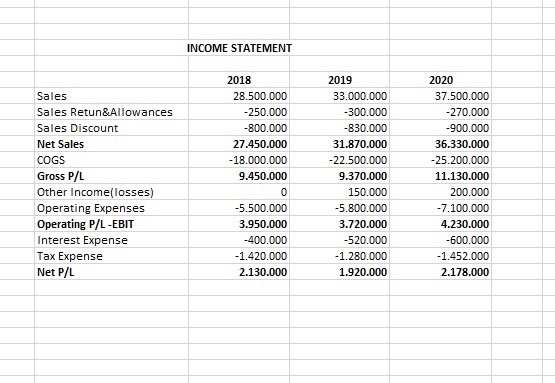
PLEASE PREPARE CASH FLOW STATEMENT FOR 2020
m st BALANCE SHEETS UI 2018 55.000 125.000 250.000 540.000 46.000 1.016.000 1.450.000 280.000 880.000 440.000 - 120.000 1.200.000 -240.000 3.890.000 2019 84.000 150.000 360.000 600.000 36.000 1.230.000 1.500.000 320.000 1.000.000 500.000 - 150.000 1.250.000 -480.000 3.940.000 2020 70.000 185.000 320.000 650.000 82.000 1.307.000 1.350.000 503.000 1.250.000 580.000 -210.000 1.500.000 -780.000 4.193.000 4.906.000 5.170.000 5.500.000 5 ASSETS 7 Cash 3 Account Receivables e Note Receivables Lo Merchandise Inventory 1 Prepaid Insurance Expense 2 TOTAL CURRENT ASSETS 3 Land 4 Land Improvements 5 Building 6 Furniture and Fixture 7 Accumulated Depreciation 8 Rights 9 Accumulated Amortization 0 TOTAL NON-CURRENT ASSETS 1 2 TOTAL ASSETS 3 4 LIABILITIES&EQUITY 5 Account Payables -6 Note Payables -7 Unearned Rent Revenue 8 TOTAL CURRENT LIABILITIES 9 Bank Credits 0 Note Payables 1 TOTAL NON-CURRENT LIABILIT 2 Common Stock 3 Additional Paid in Capital 4 Retained Earnings 5 Treasury Stock 6 TOTAL EQUITY -7 8 TOTAL LIABILITIES&EQUITY 9 O ADDITIONAL INFORMATION: -1 Outstanding Shares -2 Depreciation Expenses -3 Amortization Expense 4 Market Price per Share -5 220.000 370.000 190.000 780.000 1.000.000 340.000 1.340.000 1.300.000 1.600.000 240.000 -354.000 2.786.000 300.000 430.000 140.000 870.000 1.050.000 350.000 1.400.000 1.350.000 1.650.000 280.000 -380.000 2.900.000 250.000 530.000 140.000 920.000 1.250.000 280.000 1.530.000 1.500.000 1.650.000 340.000 -440.000 3.050.000 4.906.000 5.170.000 5.500.000 2018 1.100.000 111.000 240.000 16 2019 1.200.000 125.000 275.000 14 2020 1.300.000 133.000 285.000 17 INCOME STATEMENT Sales Sales Retun&Allowances Sales Discount Net Sales COGS Gross P/L Other Incomelosses) Operating Expenses Operating P/L-EBIT Interest Expense Tax Expense Net P/L 2018 28.500.000 -250.000 -800.000 27.450.000 -18.000.000 9.450.000 0 -5.500.000 3.950.000 -400.000 -1.420.000 2.130.000 2019 33.000.000 -300.000 -830.000 31.870.000 -22.500.000 9.370.000 150.000 -5.800.000 3.720.000 -520.000 - 1.280.000 1.920.000 2020 37.500.000 -270.000 -900.000 36.330.000 -25.200.000 11.130.000 200.000 -7.100.000 4.230.000 -600.000 -1.452.000 2.178.000 . 5 3) Prepare Cash Flow Statement for the Year 2020. in - m st BALANCE SHEETS UI 2018 55.000 125.000 250.000 540.000 46.000 1.016.000 1.450.000 280.000 880.000 440.000 - 120.000 1.200.000 -240.000 3.890.000 2019 84.000 150.000 360.000 600.000 36.000 1.230.000 1.500.000 320.000 1.000.000 500.000 - 150.000 1.250.000 -480.000 3.940.000 2020 70.000 185.000 320.000 650.000 82.000 1.307.000 1.350.000 503.000 1.250.000 580.000 -210.000 1.500.000 -780.000 4.193.000 4.906.000 5.170.000 5.500.000 5 ASSETS 7 Cash 3 Account Receivables e Note Receivables Lo Merchandise Inventory 1 Prepaid Insurance Expense 2 TOTAL CURRENT ASSETS 3 Land 4 Land Improvements 5 Building 6 Furniture and Fixture 7 Accumulated Depreciation 8 Rights 9 Accumulated Amortization 0 TOTAL NON-CURRENT ASSETS 1 2 TOTAL ASSETS 3 4 LIABILITIES&EQUITY 5 Account Payables -6 Note Payables -7 Unearned Rent Revenue 8 TOTAL CURRENT LIABILITIES 9 Bank Credits 0 Note Payables 1 TOTAL NON-CURRENT LIABILIT 2 Common Stock 3 Additional Paid in Capital 4 Retained Earnings 5 Treasury Stock 6 TOTAL EQUITY -7 8 TOTAL LIABILITIES&EQUITY 9 O ADDITIONAL INFORMATION: -1 Outstanding Shares -2 Depreciation Expenses -3 Amortization Expense 4 Market Price per Share -5 220.000 370.000 190.000 780.000 1.000.000 340.000 1.340.000 1.300.000 1.600.000 240.000 -354.000 2.786.000 300.000 430.000 140.000 870.000 1.050.000 350.000 1.400.000 1.350.000 1.650.000 280.000 -380.000 2.900.000 250.000 530.000 140.000 920.000 1.250.000 280.000 1.530.000 1.500.000 1.650.000 340.000 -440.000 3.050.000 4.906.000 5.170.000 5.500.000 2018 1.100.000 111.000 240.000 16 2019 1.200.000 125.000 275.000 14 2020 1.300.000 133.000 285.000 17 INCOME STATEMENT Sales Sales Retun&Allowances Sales Discount Net Sales COGS Gross P/L Other Incomelosses) Operating Expenses Operating P/L-EBIT Interest Expense Tax Expense Net P/L 2018 28.500.000 -250.000 -800.000 27.450.000 -18.000.000 9.450.000 0 -5.500.000 3.950.000 -400.000 -1.420.000 2.130.000 2019 33.000.000 -300.000 -830.000 31.870.000 -22.500.000 9.370.000 150.000 -5.800.000 3.720.000 -520.000 - 1.280.000 1.920.000 2020 37.500.000 -270.000 -900.000 36.330.000 -25.200.000 11.130.000 200.000 -7.100.000 4.230.000 -600.000 -1.452.000 2.178.000 . 5 3) Prepare Cash Flow Statement for the Year 2020. in


