please provide a python code for this question

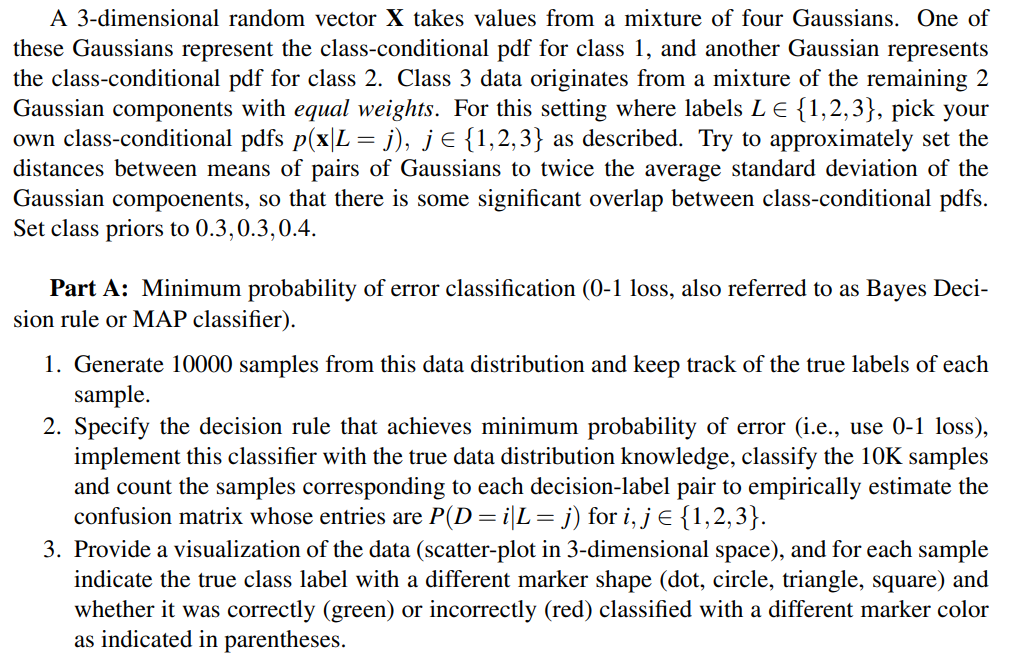
A 3-dimensional random vector X takes values from a mixture of four Gaussians. One of these Gaussians represent the class-conditional pdf for class 1, and another Gaussian represents the class-conditional pdf for class 2. Class 3 data originates from a mixture of the remaining 2 Gaussian components with equal weights. For this setting where labels LE {1,2,3), pick your own class-conditional pdfs p(x\L = j), je {1,2,3} as described. Try to approximately set the distances between means of pairs of Gaussians to twice the average standard deviation of the Gaussian compoenents, so that there is some significant overlap between class-conditional pdfs. Set class priors to 0.3,0.3,0.4. Part A: Minimum probability of error classification (0-1 loss, also referred to as Bayes Deci- sion rule or MAP classifier). 1. Generate 10000 samples from this data distribution and keep track of the true labels of each sample. 2. Specify the decision rule that achieves minimum probability of error (i.e., use 0-1 loss), implement this classifier with the true data distribution knowledge, classify the 10K samples and count the samples corresponding to each decision-label pair to empirically estimate the confusion matrix whose entries are P(D=i\L = j) for i, je {1,2,3}. 3. Provide a visualization of the data (scatter-plot in 3-dimensional space), and for each sample indicate the true class label with a different marker shape (dot, circle, triangle, square) and whether it was correctly (green) or incorrectly (red) classified with a different marker color as indicated in parentheses. A 3-dimensional random vector X takes values from a mixture of four Gaussians. One of these Gaussians represent the class-conditional pdf for class 1, and another Gaussian represents the class-conditional pdf for class 2. Class 3 data originates from a mixture of the remaining 2 Gaussian components with equal weights. For this setting where labels LE {1,2,3), pick your own class-conditional pdfs p(x\L = j), je {1,2,3} as described. Try to approximately set the distances between means of pairs of Gaussians to twice the average standard deviation of the Gaussian compoenents, so that there is some significant overlap between class-conditional pdfs. Set class priors to 0.3,0.3,0.4. Part A: Minimum probability of error classification (0-1 loss, also referred to as Bayes Deci- sion rule or MAP classifier). 1. Generate 10000 samples from this data distribution and keep track of the true labels of each sample. 2. Specify the decision rule that achieves minimum probability of error (i.e., use 0-1 loss), implement this classifier with the true data distribution knowledge, classify the 10K samples and count the samples corresponding to each decision-label pair to empirically estimate the confusion matrix whose entries are P(D=i\L = j) for i, je {1,2,3}. 3. Provide a visualization of the data (scatter-plot in 3-dimensional space), and for each sample indicate the true class label with a different marker shape (dot, circle, triangle, square) and whether it was correctly (green) or incorrectly (red) classified with a different marker color as indicated in parentheses


