

Answered step by step
Verified Expert Solution
Question
1 Approved Answer
please provide all steps/logic used to get to the answer :) its much appreciated! risk 2 1 -1 1 5% -1 0 Practice Question 2
please provide all steps/logic used to get to the answer :) its much appreciated! 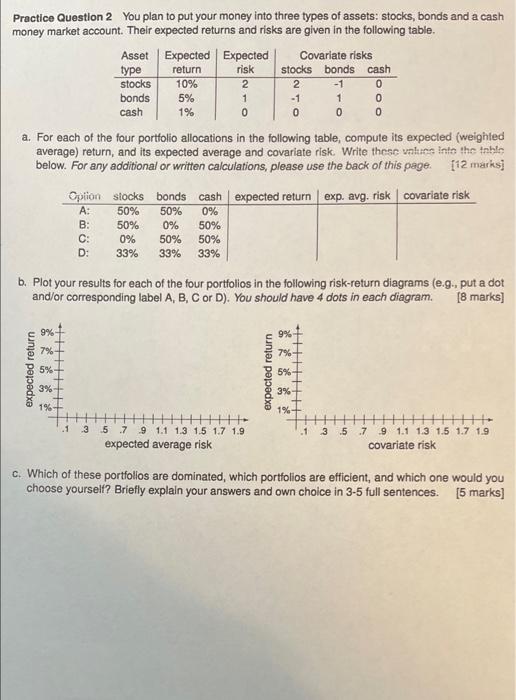
risk 2 1 -1 1 5% -1 0 Practice Question 2 You plan to put your money into three types of assets: stocks, bonds and a cash money market account. Their expected returns and risks are given in the following table. Asset Expected Expected Covariate risks type return stocks bonds cash stocks 10% 2 0 bonds cash 1% 0 0 0 0 a. For each of the four portfolio allocations in the following table, compute its expected (weighted average) return, and its expected average and covariate risk. Write these values into the tnble below. For any additional or written calculations, please use the back of this page [12 marks] Option Stocks bonds cash expected return exp. avg. risk covariate risk 50% 50% 0% B: 50% 0% 50% C: 0% 50% 50% D: 33% 33% 33% A: b. Plot your results for each of the four portfolios in the following risk-return diagrams (e.g., put a dot and/or corresponding label A, B, C or D). You should have 4 dots in each diagram. [8 marks] expected return 5% B expected return 5% 3% 3% 1% 1% .13 HH 5 7 9 1.1 1.3 1.5 1.7 1.9 expected average risk .1 3 + H - .5 7 9 1.1 1.3 1.5 1.7 1.9 covariate risk c. Which of these portfolios are dominated, which portfolios are efficient, and which one would you choose yourself? Briefly explain your answers and own choice in 3-5 full sentences. (5 marks] risk 2 1 -1 1 5% -1 0 Practice Question 2 You plan to put your money into three types of assets: stocks, bonds and a cash money market account. Their expected returns and risks are given in the following table. Asset Expected Expected Covariate risks type return stocks bonds cash stocks 10% 2 0 bonds cash 1% 0 0 0 0 a. For each of the four portfolio allocations in the following table, compute its expected (weighted average) return, and its expected average and covariate risk. Write these values into the tnble below. For any additional or written calculations, please use the back of this page [12 marks] Option Stocks bonds cash expected return exp. avg. risk covariate risk 50% 50% 0% B: 50% 0% 50% C: 0% 50% 50% D: 33% 33% 33% A: b. Plot your results for each of the four portfolios in the following risk-return diagrams (e.g., put a dot and/or corresponding label A, B, C or D). You should have 4 dots in each diagram. [8 marks] expected return 5% B expected return 5% 3% 3% 1% 1% .13 HH 5 7 9 1.1 1.3 1.5 1.7 1.9 expected average risk .1 3 + H - .5 7 9 1.1 1.3 1.5 1.7 1.9 covariate risk c. Which of these portfolios are dominated, which portfolios are efficient, and which one would you choose yourself? Briefly explain your answers and own choice in 3-5 full sentences. (5 marks] Step by Step Solution
There are 3 Steps involved in it
Step: 1

Get Instant Access to Expert-Tailored Solutions
See step-by-step solutions with expert insights and AI powered tools for academic success
Step: 2

Step: 3
Ace Your Homework with AI
Get the answers you need in no time with our AI-driven, step-by-step assistance
Get Started
Finance For Non Financial Managers
Authors: Gene Siciliano
1st Edition
0071413774, 978-0071413770