Please provide an attached Excel file
Thank you!

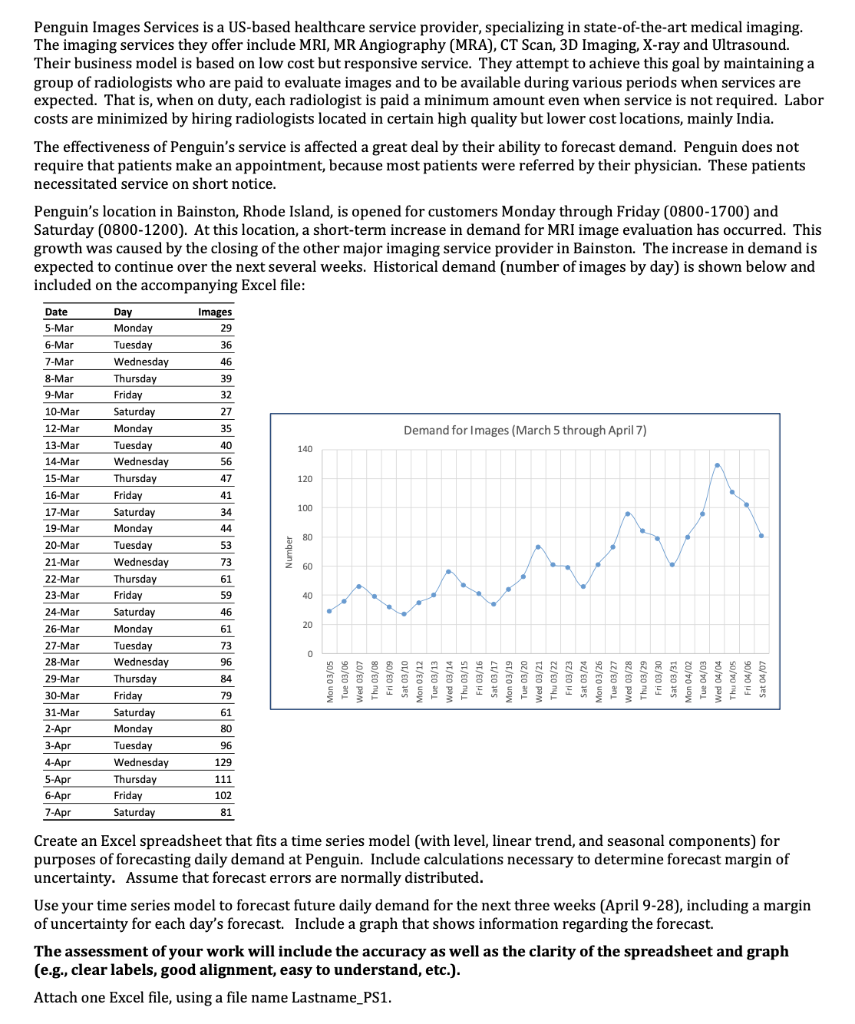
Penguin Images Services is a US-based healthcare service provider, specializing in state-of-the-art medical imaging. The imaging services they offer include MRI, MR Angiography (MRA), CT Scan, 3D Imaging, X-ray and Ultrasound. Their business model is based on low cost but responsive service. They attempt to achieve this goal by maintaining a group of radiologists who are paid to evaluate images and to be available during various periods when services are expected. That is, when on duty, each radiologist is paid a minimum amount even when service is not required. Labor costs are minimized by hiring radiologists located in certain high quality but lower cost locations, mainly India. The effectiveness of Penguin's service is affected a great deal by their ability to forecast demand. Penguin does not require that patients make an appointment, because most patients were referred by their physician. These patients necessitated service on short notice. Penguin's location in Bainston, Rhode Island, is opened for customers Monday through Friday (0800-1700) and Saturday 0800-1200). At this location, a short-term increase in demand for MRI image evaluation has occurred. This growth was caused by the closing of the other major imaging service provider in Bainston. The increase in demand is expected to continue over the next several weeks. Historical demand (number of images by day) is shown below and included on the accompanying Excel file: Date 5-Mar 6-Mar 7-Mar 8-Mar 9-Mar 10-Mar 12-Mar 13-Mar 14-Mar Images 29 36 46 39 32 27 35 Demand for Images (March 5 through April 7) 40 140 56 Day Monday Tuesday Wednesday Thursday Friday Saturday Monday Tuesday Wednesday Thursday Friday Saturday Monday Tuesday Wednesday Thursday Friday Saturday Monday 120 15-Mar 16-Mar 17-Mar 19-Mar 47 41 34 44 100 80 Number WA z 60 53 73 61 59 46 61 40 20 Tuesday Wednesday 0 20-Mar 21-Mar 22-Mar 23-Mar 24-Mar 26-Mar 27-Mar 28-Mar 29-Mar 30-Mar 31-Mar 2-Apr 3-Apr 4-Apr 5-Apr 6-Apr 7-Apr 73 96 84 79 de / Fri 03/09 Sat 03/10 Mon 03/12 Tue 05/13 Tea Thu 03/15 FS15 w 02/0 Ved 03/21 "hu 03/22 Fri 03/23 Sat 03/24 Mon 03/26 Tue 03/27 Ved 03/28 u 03/29 Fri 08/30 Ts/enses Intent Fri 04/06 at 04/07 61 80 Thursday Friday Saturday Monday Tuesday Wednesday Thursday Friday Saturday 96 129 111 102 81 Create an Excel spreadsheet that fits a time series model (with level, linear trend, and seasonal components) for purposes of forecasting daily demand at Penguin. Include calculations necessary to determine forecast margin of uncertainty. Assume that forecast errors are normally distributed. Use your time series model to forecast future daily demand for the next three weeks (April 9-28), including a margin of uncertainty for each day's forecast. Include a graph that shows information regarding the forecast. The assessment of your work will include the accuracy as well as the clarity of the spreadsheet and graph (e.g., clear labels, good alignment, easy to understand, etc.). Attach one Excel file, using a file name Lastname_PS1


