Answered step by step
Verified Expert Solution
Question
1 Approved Answer
Please provide an explanation of what the Measurement model entails in these charts... This is for information systems strategies. Organizational performance 0.25 0.33 0.17 0.81
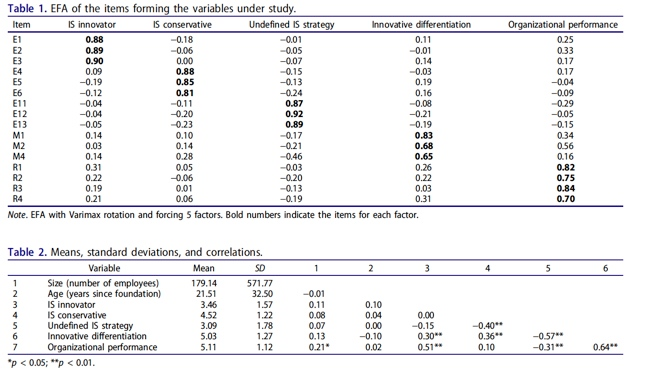
Please provide an explanation of what the Measurement model entails in these charts... This is for information systems strategies.
Organizational performance 0.25 0.33 0.17 0.81 Table 1. EFA of the items forming the variables under study. Item IS innovator IS conservative Undefined is strategy Innovative differentiation E1 0.88 -0.18 -0.01 0.11 E2 0.89 -0.06 -0.05 -0.01 E3 0.90 0.00 -0.07 0.14 E4 0.09 0.88 -0.15 -0.03 ES -0.19 0.85 -0.13 0.19 E6 -0.12 -0.24 0.16 E11 -0.04 -0.11 0.87 -0.08 E12 -0.04 -0.20 0.92 -0.21 E13 -0.05 -0.23 0.89 -0.19 MI 0.14 0.10 -0.17 0.83 M2 0.03 0.14 -0.21 0.68 M4 0.14 0.28 -0.46 0.65 R1 0.31 0.05 -0.03 0.26 R2 0.22 -0.06 -0.20 0.22 R3 0.19 0.01 -0.13 0.03 R4 0.21 0.06 -0.19 0.31 Note. EFA with Varimax rotation and forcing 5 factors. Bold numbers indicate the items for each factor. 0.17 -0.04 -0.09 -0.29 -0.05 -0.15 0.34 0.56 0.16 0.82 0.75 0.84 0.70 1 2 3 4 5 6 1 Table 2. Means, standard deviations, and correlations. Variable Mean SD Size (number of employees) 179.14 571.77 2 Age (years since foundation) 21.51 32.50 3 IS innovator 3.46 1.57 4 IS conservative 4.52 1.22 5 Undefined i strategy 3.09 6 Innovative differentiation 5.03 1.27 7 Organizational performance 5.11 1.12 *pStep by Step Solution
There are 3 Steps involved in it
Step: 1
Get Instant Access to Expert-Tailored Solutions
See step-by-step solutions with expert insights and AI powered tools for academic success
Step: 2
Step: 3
Ace Your Homework with AI
Get the answers you need in no time with our AI-driven, step-by-step assistance
Get Started