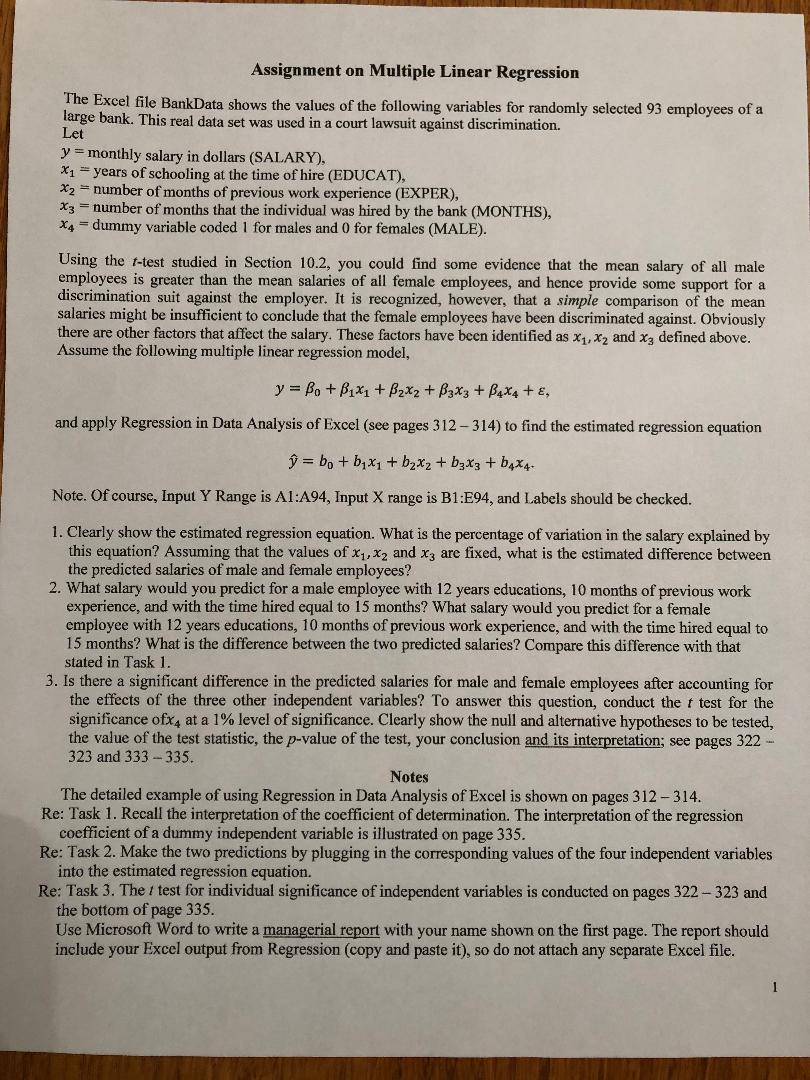
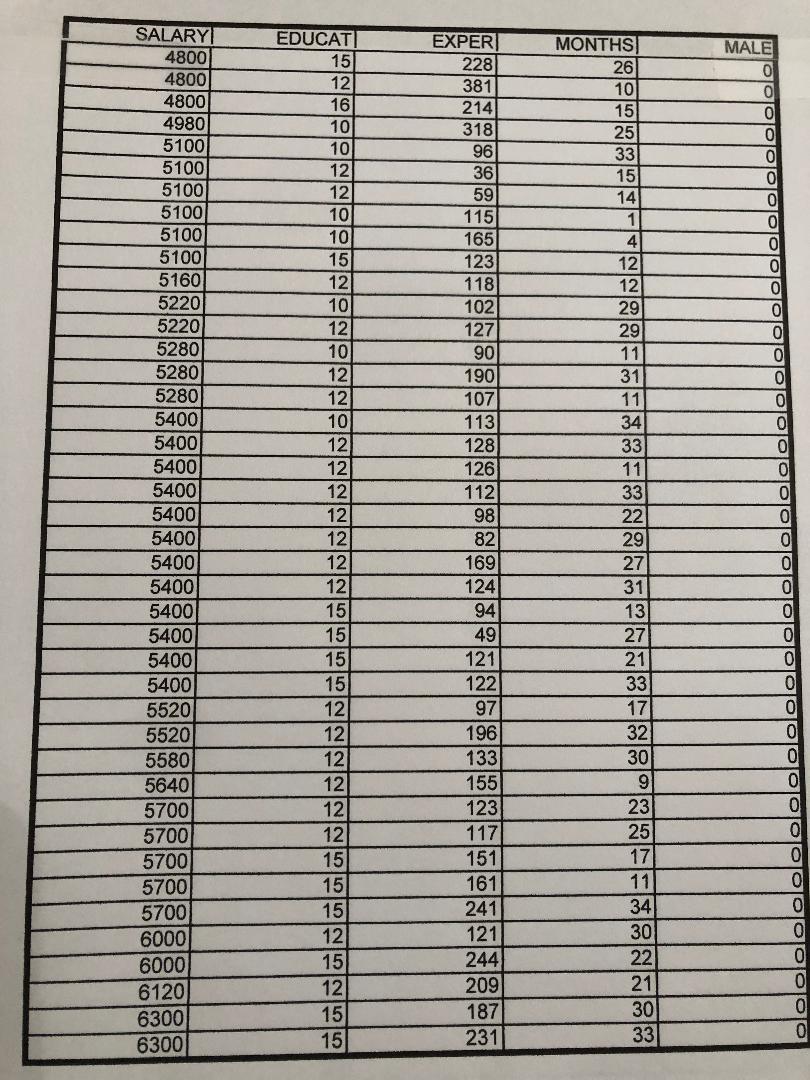
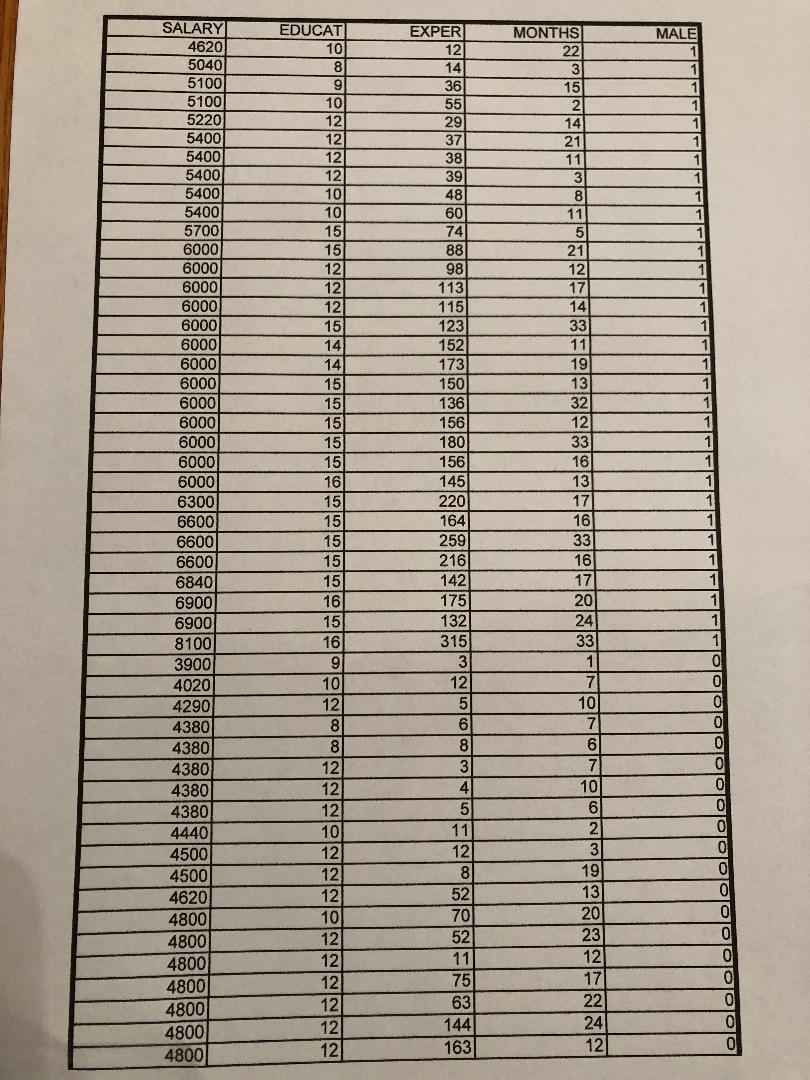
Please provide answers to all parts of the 3 posted questions. Photos provide guidance for answers
1. Clearly show the estimated regression equation. What is the percentage of variation in the salary explained by this equation? Assuming that the values of and are fixed, what is the estimated difference between the predicted salaries of male and female employees?
2. What salary would you predict for a male employee with 12 years educations, 10 months of previous work experience, and with the time hired equal to 15 months? What salary would you predict for a female employee with 12 years educations, 10 months of previous work experience, and with the time hired equal to 15 months? What is the difference between the two predicted salaries? Compare this difference with that stated in Task 1.
3. Is there a significant difference in the predicted salaries for male and female employees after accounting for the effects of the three other independent variables? To answer this question, conduct the t test for the significance ofat a 1% level of significance. Clearly show the null and alternative hypotheses to be tested, the value of the test statistic, the p-value of the test, your conclusion and its interpretation; see pages 322 - 323 and 333 - 335.
Assignment on Multiple Linear Regression The Excel File Bank Data shows the values of the following variables for randomly selected 93 employees of a Let large bank . This real data set was used in a court lawsuit against discrimination . V = monthly salary in dollars ( SALARY]. * 1 = years of schooling at the time of hire [ EDUCATY. * 2 = number of months of previous work experience ( EXPER ) , * = = number of months that the individual was hired by the bank ( MONTHS) . * 4 = dummy variable coded I for males and O for females ( MALE). Using the {-test studied in Section 10.2, you could Find some evidence that the mean salary of all male employees is greater than the mean salaries of all female employees , and hence provide some support for a discrimination suit against the employer . It is recognized , however , that a simple comparison of the mean salaries might be insufficient to conclude that the female employees have been discriminated against . Obviously there are other factors that affect the salary . These factors have been identified as * 1 , *'2 and *; defined above . Assume the following multiple linear regression model . * = Bot Bix, + Bzzz + Box; + BAXATE. and apply Regression in Data Analysis of Excel ( see pages 312 - 314 ) to find the estimated regression equation D = but bix, + 62^2 + ba` + 64^ Note . Of course , Input } Range is $1: 194, Input X range is $1 : $94, and Labels should be checked . 1 . Clearly show the estimated repression equation . What is the percentage of variation in the salary explained by this equation ? Assuming that the values of* 1 . * 2 and *; are liked . what is the estimated difference between the predicted salaries of male and female employees ?` 2. What salary would you predict for a male employee with 12 years educations , 10 months of previous work experience , and with the time hired equal to 15 months ? What salary would you predict for a female employee with 12 years educations , 10 months of previous work experience , and with the time hired equal to 15 months ? What is the difference between the two predicted salaries ? Compare this difference with that stated in Task ] . 3 . Is there a significant difference in the predicted salaries for male and female employees after accounting for* the effects of the three other independent variables? To answer this question , conduct the I test for the significance of* , at a 1%/ level of significance . Clearly show the null and alternative hypotheses to be tested , the value of the test statistic , the p -value of the test , your conclusion and it's interpretation ; see pages 322* 323 and 373 - 335 .` Notes The detailed example of using Regression in Data Analysis of Excel is shown on pages 312 - 314. Re : Task 1 . Recall the interpretation of the coefficient of determination . The interpretation of the regression coefficient of a dummy independent variable is illustrated on page 3.35 . Re : Task 2. Make the two predictions by plugging in the corresponding values of the four independent variables* into the estimated regression equation . Re: Task ] . The ! test for individual significance of independent variables is conducted on pages 322 - 323 and the bottom of page 335 .` Use Microsoft Word to write & managerial report with your name shown on the first page . The report should include your Excel output from Regression ( copy and paste it ) , so do not attach any separate Excel file .SALARY EDUCATI 4800 EXPER MONTHS 15\\ MALE 4800 228 12\\ 26 381 101 4800 16\\ 4980 101 214 318 15\\ 5100 101 5100 96 25\\ 5100 12 36 12 5100 59 101 115 5100 5100 10| 165 15\\ 123 5160 5220 121 1 18 101 102 5220 121 5280 127 101 90 5280 121 190 5280 121 107 5400 101 113 5400 121 128 5400 12) 126 5400 112 5400 98 5400 82 \\0 10 1 0 / 0 10 1 0 | 0 | 0 | 0 | 0 / 0 1 0 1 0 | 0 | 0 | 0 | 0 | 0 | 0 | 0 | 0 |0 |0 |0 |0 | 0 | 0 |0 /0 10 | 0 |0 | 0 |0 | 0 |0 |0 |0 |0 | 0 | { 5400 169 5400 124 5400 94 5400 49 5400 121 5400 122 5520 97 5:520 196 5580 \\CHIN CHIN| GIGI| GIN| NU| NO| NO| N| NOT CM GI GI| NUNN| NIN| 133 5640 155 5700 123 5700 717\\ 5700 151 5700 161 5700 241 34 6000 121 30 6000 244 22 6120 209 21 6:300 187 30 6:300 15 231 33\f


