Answered step by step
Verified Expert Solution
Question
1 Approved Answer
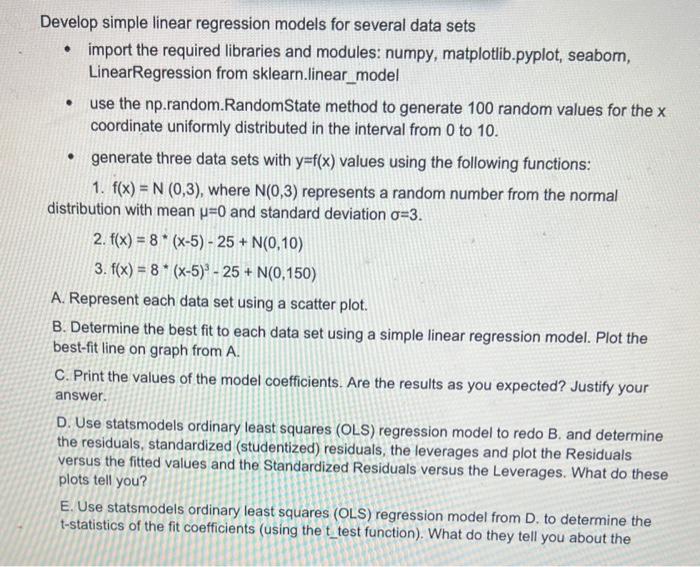
please provide code Develop simple linear regression models for several data sets - import the required libraries and modules: numpy, matplotlib.pyplot, seaborn, LinearRegression from sklearn.linear_model
please provide code 
Develop simple linear regression models for several data sets - import the required libraries and modules: numpy, matplotlib.pyplot, seaborn, LinearRegression from sklearn.linear_model - use the np.random. RandomState method to generate 100 random values for the x coordinate uniformly distributed in the interval from 0 to 10. - generate three data sets with y=f(x) values using the following functions: 1. f(x)=N(0,3), where N(0,3) represents a random number from the normal distribution with mean =0 and standard deviation =3. 2. f(x)=8(x5)25+N(0,10) 3. f(x)=8(x5)325+N(0,150) A. Represent each data set using a scatter plot. B. Determine the best fit to each data set using a simple linear regression model. Plot the best-fit line on graph from A. C. Print the values of the model coefficients. Are the results as you expected? Justify your answer. D. Use statsmodels ordinary least squares (OLS) regression model to redo B. and determine the residuals, standardized (studentized) residuals, the leverages and plot the Residuals versus the fitted values and the Standardized Residuals versus the Leverages. What do these plots tell you? E. Use statsmodels ordinary least squares (OLS) regression model from D. to determine the t-statistics of the fit coefficients (using the t test function). What do they tell you about the 
Step by Step Solution
There are 3 Steps involved in it
Step: 1

Get Instant Access to Expert-Tailored Solutions
See step-by-step solutions with expert insights and AI powered tools for academic success
Step: 2

Step: 3

Ace Your Homework with AI
Get the answers you need in no time with our AI-driven, step-by-step assistance
Get Started


