Answered step by step
Verified Expert Solution
Question
1 Approved Answer
please provide code in R language Question 3 (40pts) The fights_from_NYC dataset is a random sample of departing flights from the three airports serving New

please provide code in R language
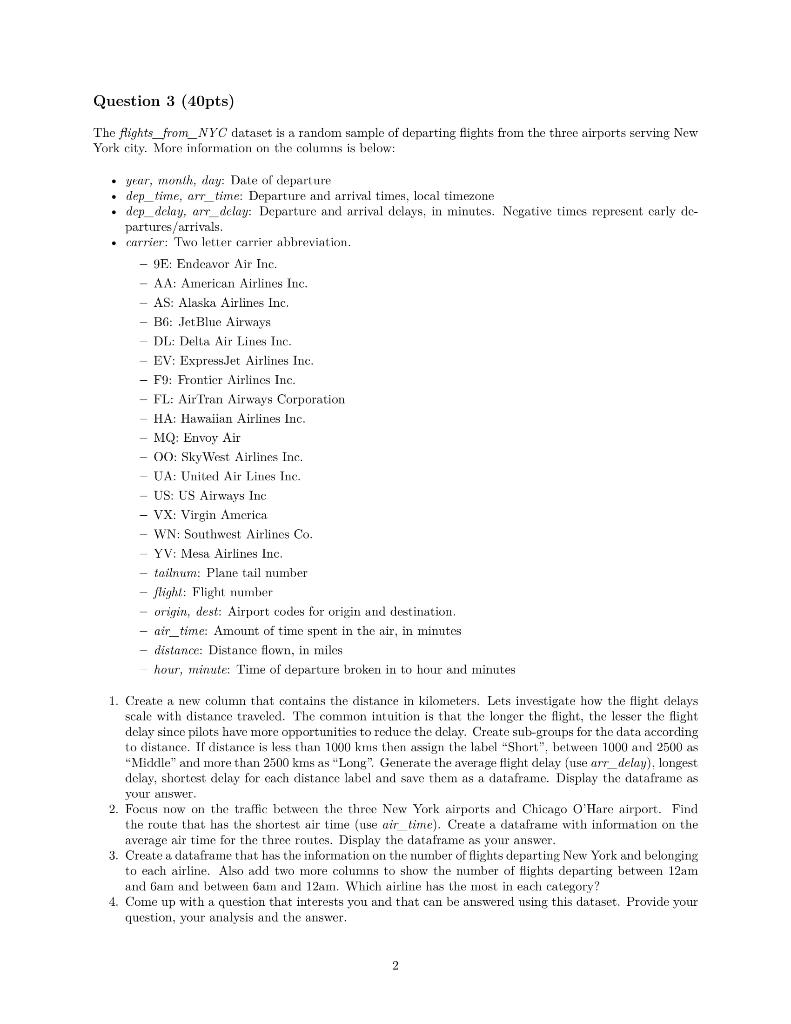
Question 3 (40pts) The fights_from_NYC dataset is a random sample of departing flights from the three airports serving New York city. More information on the columns is below: year, month day: Date of departure dep_time, arr_time: Departure and arrival times, local timezone dep_delay, ary_delay: Departure and arrival delays, in minutes. Negative times represent carly de- partures/arrivals. carrier: Two letter carrier abbreviation. 9E: Endeavor Air Inc. AA: American Airlines Inc. AS: Alaska Airlines Inc. B6: JetBlue Airways DL: Delta Air Lines Inc. EV: ExpressJet Airlines Inc. - F9: Frontier Airlines Inc. FL: Air Tran Airways Corporation HA: Hawaiian Airlines Inc. MQ: Envoy Air 00: Sky West Airlines Inc. UA: United Air Lines Inc. US: US Airways Inc - VX: Virgin America WN: Southwest Airlines Co. YV: Mesa Airlines Inc. tailnum: Plane tail number flight: Flight number - origin, dest: Airport codes for origin and destination, - air_time: Amount of time spent in the air, in minutes - distance: Distance flown, in miles hour, minute: Time of departure broken in to hour and minutes 1. Create a new column that contains the distance in kilometers. Lets investigate how the flight delays scale with distance traveled. The common intuition is that the longer the flight, the lesser the flight delay since pilots have more opportunities to reduce the delay. Create sub-groups for the data according to distance. If distance is less than 1000 kms then assign the label "Short", between 1000 and 2500 as "Middle" and more than 2500 kms as "Long". Generate the average flight delay (1se arr_delay). longest delay, shortest delay for cach distance label and save them as a dataframo. Display the dataframe as your answer. 2. Focus now on the traffic between the three New York airports and Chicago O'Hare airport. Find the route that has the shortest air time (use air_time). Create a dataframe with information on the average air time for the three routes. Display the dataframe as your answer. 3. Create a dataframe that has the information on the number of flights departing New York and belonging to each airline. Also add two more columns to show the number of flights departing between 12am and 6am and between 6am and 12am. Which airline has the most in each category? 4. Come up with a question that interests you and that can be answered using this dataset. Provide your question, your analysis and the answer. 2Step by Step Solution
There are 3 Steps involved in it
Step: 1

Get Instant Access to Expert-Tailored Solutions
See step-by-step solutions with expert insights and AI powered tools for academic success
Step: 2

Step: 3

Ace Your Homework with AI
Get the answers you need in no time with our AI-driven, step-by-step assistance
Get Started


