Answered step by step
Verified Expert Solution
Question
1 Approved Answer
Please provide details Company C wants to invest in a new project with the below projections. use any Key Financial Ratios (Profitability ratios, Liquidity ratios,

Please provide details
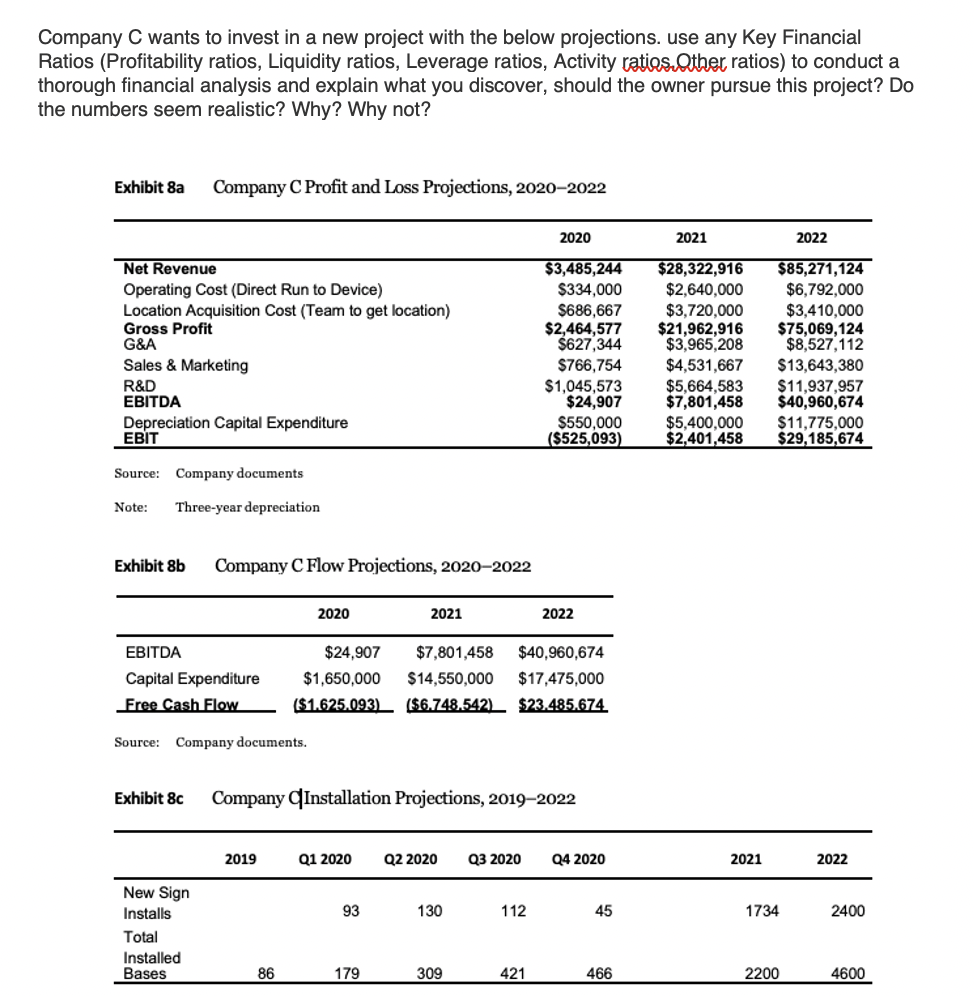
Company C wants to invest in a new project with the below projections. use any Key Financial Ratios (Profitability ratios, Liquidity ratios, Leverage ratios, Activity ratias. Other ratios) to conduct a thorough financial analysis and explain what you discover, should the owner pursue this project? Do the numbers seem realistic? Why? Why not? Exhibit sa Company Profit and Loss Projections, 2020-2022 2020 2021 2022 Net Revenue Operating Cost (Direct Run to Device) Location Acquisition Cost (Team to get location) Gross Profit G&A Sales & Marketing R&D EBITDA Depreciation Capital Expenditure EBIT $3,485,244 $334,000 $686,667 $2,464,577 $627,344 $766,754 $1,045,573 $24,907 $550,000 ($525,093) $28,322,916 $2,640,000 $3,720,000 $21,962,916 $3,965,208 $4,531,667 $5,664,583 $7,801,458 $5,400,000 $2,401,458 $85,271,124 $6,792,000 $3,410,000 $75,069,124 $8,527,112 $13,643,380 $11,937,957 $40,960,674 $11,775,000 $29,185,674 Source: Company documents Note: Three-year depreciation Exhibit 8b Company C Flow Projections, 2020-2022 2020 2021 2022 EBITDA Capital Expenditure Free Cash Flow $24,907 $7,801,458 $40,960,674 $1,650,000 $14,550,000 $17,475,000 ($1.625.093) ($6.748.542) $23.485.674 Source: Company documents. Exhibit 8c Company (Installation Projections, 2019-2022 2019 Q1 2020 Q2 2020 Q3 2020 Q4 2020 2021 2022 93 130 112 45 1734 2400 New Sign Installs Total Installed Bases 86 179 309 421 466 2200 4600 Company C wants to invest in a new project with the below projections. use any Key Financial Ratios (Profitability ratios, Liquidity ratios, Leverage ratios, Activity ratias. Other ratios) to conduct a thorough financial analysis and explain what you discover, should the owner pursue this project? Do the numbers seem realistic? Why? Why not? Exhibit sa Company Profit and Loss Projections, 2020-2022 2020 2021 2022 Net Revenue Operating Cost (Direct Run to Device) Location Acquisition Cost (Team to get location) Gross Profit G&A Sales & Marketing R&D EBITDA Depreciation Capital Expenditure EBIT $3,485,244 $334,000 $686,667 $2,464,577 $627,344 $766,754 $1,045,573 $24,907 $550,000 ($525,093) $28,322,916 $2,640,000 $3,720,000 $21,962,916 $3,965,208 $4,531,667 $5,664,583 $7,801,458 $5,400,000 $2,401,458 $85,271,124 $6,792,000 $3,410,000 $75,069,124 $8,527,112 $13,643,380 $11,937,957 $40,960,674 $11,775,000 $29,185,674 Source: Company documents Note: Three-year depreciation Exhibit 8b Company C Flow Projections, 2020-2022 2020 2021 2022 EBITDA Capital Expenditure Free Cash Flow $24,907 $7,801,458 $40,960,674 $1,650,000 $14,550,000 $17,475,000 ($1.625.093) ($6.748.542) $23.485.674 Source: Company documents. Exhibit 8c Company (Installation Projections, 2019-2022 2019 Q1 2020 Q2 2020 Q3 2020 Q4 2020 2021 2022 93 130 112 45 1734 2400 New Sign Installs Total Installed Bases 86 179 309 421 466 2200 4600Step by Step Solution
There are 3 Steps involved in it
Step: 1

Get Instant Access to Expert-Tailored Solutions
See step-by-step solutions with expert insights and AI powered tools for academic success
Step: 2

Step: 3

Ace Your Homework with AI
Get the answers you need in no time with our AI-driven, step-by-step assistance
Get Started


