

Question
PLEASE PROVIDE PYTHON 3 SOLUTION IN JUPYTR NOTEBOOK This has question has 14 steps. please be sure to provide solutions to all steps under their
PLEASE PROVIDE PYTHON 3 SOLUTION IN JUPYTR NOTEBOOK This has question has 14 steps. please be sure to provide solutions to all steps under their headings like step 1: input code output solution
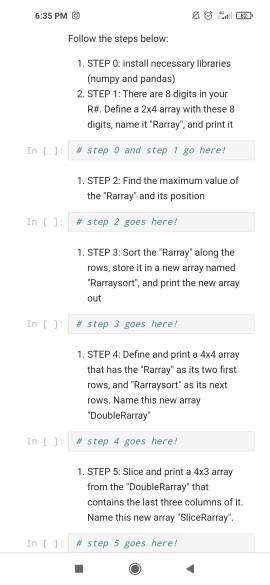
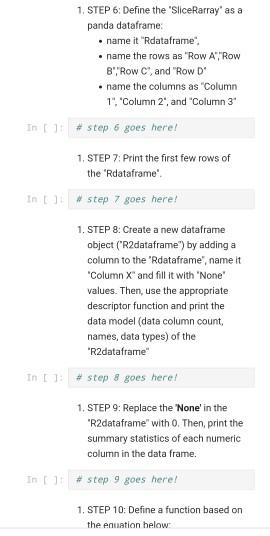
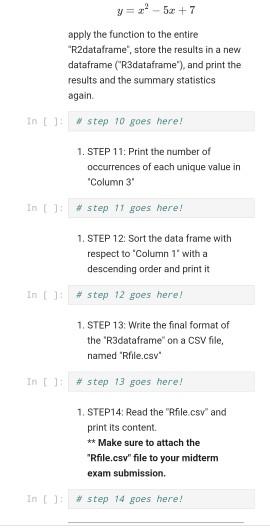
6:35 PM 0 Follow the steps below: 1. STEP O: Install necessary libraries (numpy and pandas) 2. STEP 1: There are 8 digits in your R# Define a 2x4 array with these 8 digits, name it "Rarray", and print it In 1 step and step 1 go here! 1. STEP 2: Find the maximum value of the "Rarray" and its position In #step 2 goes here! 1. STEP 3: Sort the "Rarray' along the rows, store it in a new array named "Rarraysort, and print the new array out In 1: #step 3 goes here! 1. STEP 4: Define and print a 4x4 array that has the "Rarray" as its two first rows, and "Rarraysort' as its next rows. Name this new array 'DoubleRarray In 1 step 4 goes here! 1. STEP 5: Slice and print a 4x3 array from the "DoubleRarray" that contains the last three columns of it. Name this new array "Slice array #step 5 goes here! 1. STEP 6: Define the 'Slice array' as a panda dataframe .name it "Rdataframe .name the rows as "Row A Row 8'Row C', and "RowD .name the columns as "Column 1", "Column 2", and "Column 3 In + step 6 goes here! 1, STEP 7: Print the first few rows of the "Rdataframe' In step 7 goes here! 1. STEP 8: Create a new dataframe object ("R2dataframe") by adding a column to the "Rdataframe", name it "Column X and fill it with "None values. Then, use the appropriate descriptor function and print the data model (data column count, names, data types) of the "R2dataframe" In 1: #step 8 goes here! 1. STEP 9: Replace the "None' in the "R2dataframe" with O. Then, print the summary statistics of each numeric column in the data frame. # step 9 goes here! 1. STEP 10: Define a function based on the equation below y=x?- 5x+7 apply the function to the entire "R2dataframe', store the results in a new dataframe ("R3dataframe"), and print the results and the summary statistics again In 1: step 10 goes here! 1. STEP 11: Print the number of occurrences of each unique value in "Column 3 In 1: step 11 goes here! 1. STEP 12 Sort the data frame with respect to 'Column 1' with a descending order and print it In #step 12 goes here! 1. STEP 13: Write the final format of the "R3dataframe" on a csv file, named "Rfile.csv In #step 13 goes here! 1. STEP14. Read the "file.csv" and print its content ** Make sure to attach the "Rfile.csv" file to your midterm exam submission. #step 14 goes hereStep by Step Solution
There are 3 Steps involved in it
Step: 1

Get Instant Access to Expert-Tailored Solutions
See step-by-step solutions with expert insights and AI powered tools for academic success
Step: 2

Step: 3
Ace Your Homework with AI
Get the answers you need in no time with our AI-driven, step-by-step assistance
Get Started
DB2 11 The Ultimate Database For Cloud Analytics And Mobile
Authors: John Campbell, Chris Crone, Gareth Jones, Surekha Parekh, Jay Yothers
1st Edition
1583474013, 978-1583474013