please provide R coding
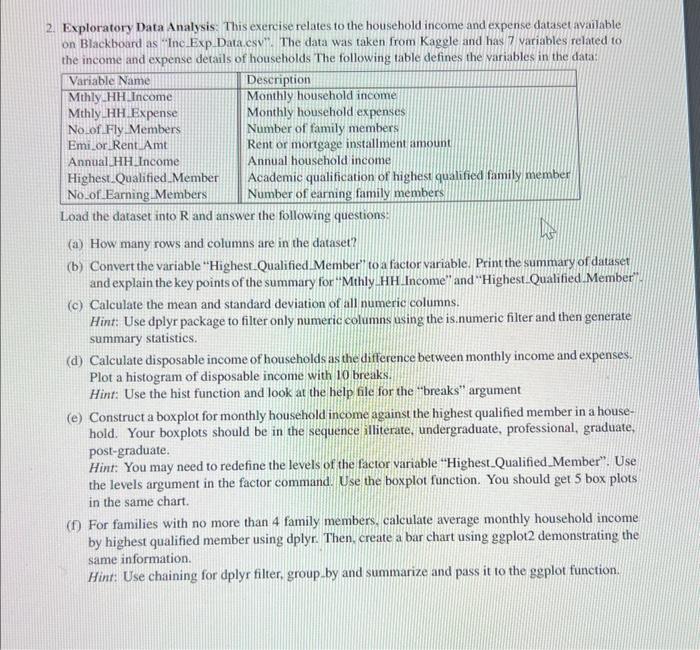
Exploratory Data Analysis: This exercise relates to the household income and expense dataset ayailable on Blackboard as "Inc Exp.Data.csv". The data was taken from Kaggle and has 7 variables related to the income and expense details of households The following table defines the variables in the data: Load the dataset into R and answer the following questions: (a) How many rows and columns are in the dataset? (b) Convert the variable "Highest_Qualified Member" to a factor variable. Print the summary of dataset and explain the key points of the summary for "Mthly _HH Income" and "Highest.Qualified Member"" (c) Calculate the mean and standard deviation of all numeric columns. Hint: Use dplyr package to filter only numeric columns using the is numeric filter and then generate summary statistics. (d) Calculate disposable income of households as the difference between monthly income and expenses. Plot a histogram of disposable income with 10 breaks. Hint: Use the hist function and look at the help file for the "breaks" argument (e) Construct a boxplot for monthly household income against the highest qualified member in a household. Your boxplots should be in the sequence illiterate, undergraduate, professional, graduate, post-graduate. Hint: You may need to redefine the levels of the factor variable "Highest_Qualified_Member". Use the levels argument in the factor command. Use the boxplot function. You should get 5 box plots in the same chart. (f) For families with no more than 4 family members, calculate average monthly household income by highest qualified member using dplyr. Then. create a bar chart using ggplot2 demonstrating the same information. Hint: Use chaining for dplyr filter, group_by and summarize and pass it to the ggplot function. Exploratory Data Analysis: This exercise relates to the household income and expense dataset ayailable on Blackboard as "Inc Exp.Data.csv". The data was taken from Kaggle and has 7 variables related to the income and expense details of households The following table defines the variables in the data: Load the dataset into R and answer the following questions: (a) How many rows and columns are in the dataset? (b) Convert the variable "Highest_Qualified Member" to a factor variable. Print the summary of dataset and explain the key points of the summary for "Mthly _HH Income" and "Highest.Qualified Member"" (c) Calculate the mean and standard deviation of all numeric columns. Hint: Use dplyr package to filter only numeric columns using the is numeric filter and then generate summary statistics. (d) Calculate disposable income of households as the difference between monthly income and expenses. Plot a histogram of disposable income with 10 breaks. Hint: Use the hist function and look at the help file for the "breaks" argument (e) Construct a boxplot for monthly household income against the highest qualified member in a household. Your boxplots should be in the sequence illiterate, undergraduate, professional, graduate, post-graduate. Hint: You may need to redefine the levels of the factor variable "Highest_Qualified_Member". Use the levels argument in the factor command. Use the boxplot function. You should get 5 box plots in the same chart. (f) For families with no more than 4 family members, calculate average monthly household income by highest qualified member using dplyr. Then. create a bar chart using ggplot2 demonstrating the same information. Hint: Use chaining for dplyr filter, group_by and summarize and pass it to the ggplot function