Answered step by step
Verified Expert Solution
Question
1 Approved Answer
*Please provide solutions with formulas. Tax liabilities 16,809 2,403,645 (362,533) Net Current Liabilities Non-Current Liabilities Payables 389,519 Derivative financial instruments 2,737 Borrowings 3,319,454 Deferred tax
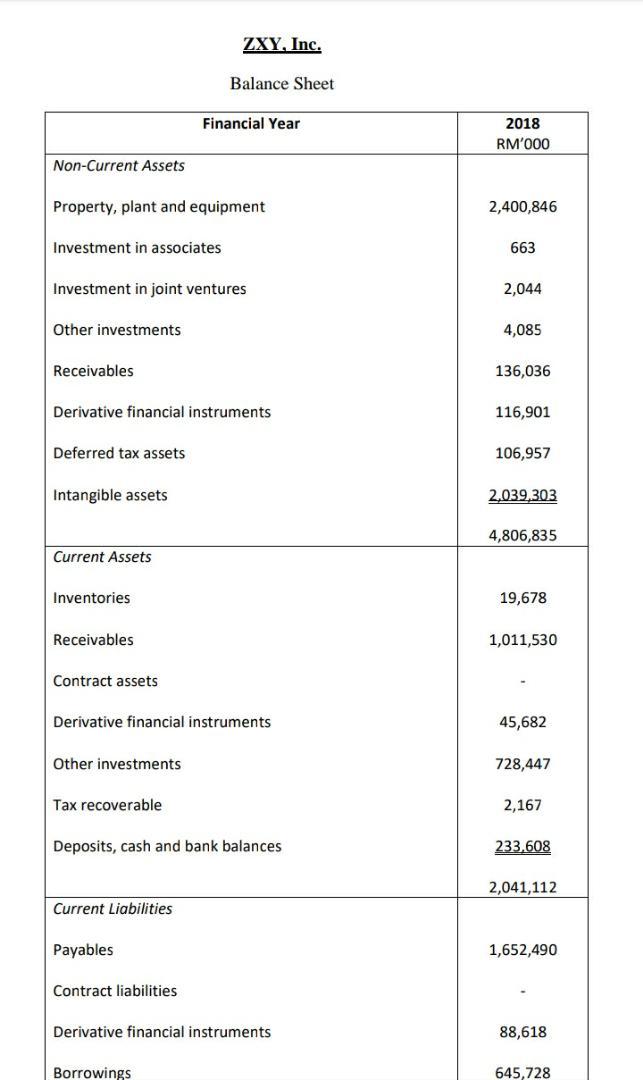
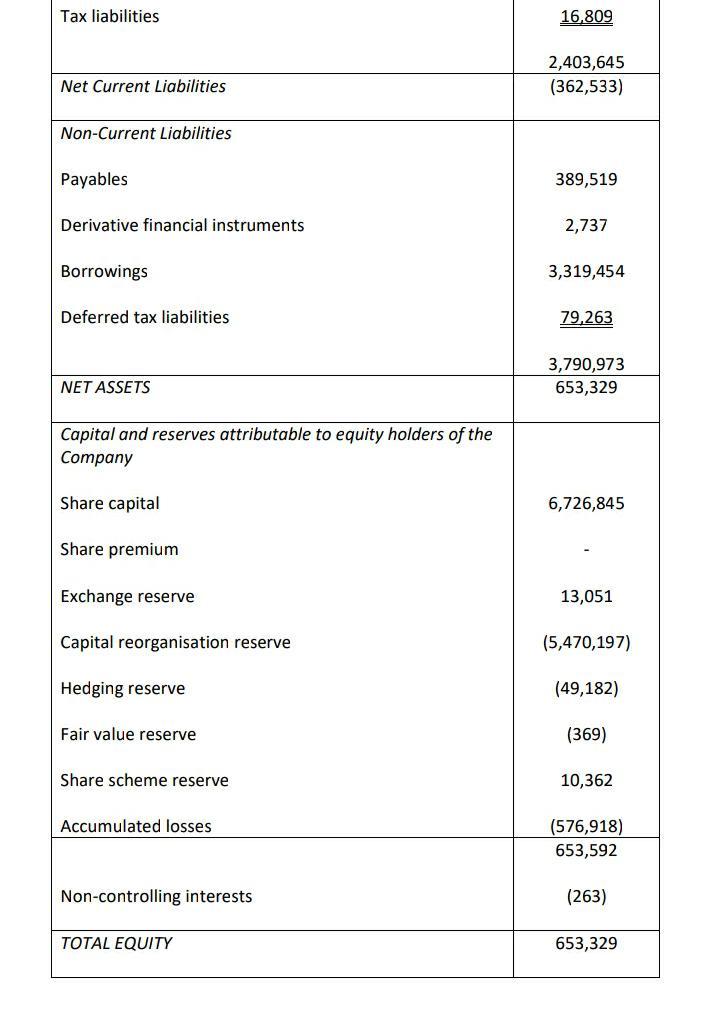
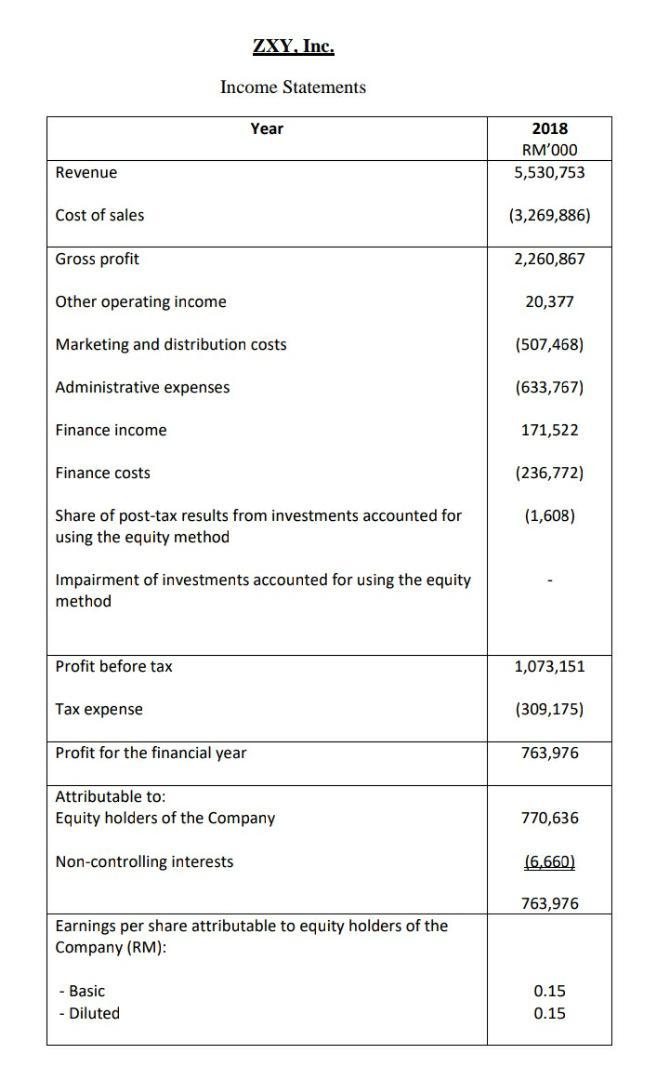
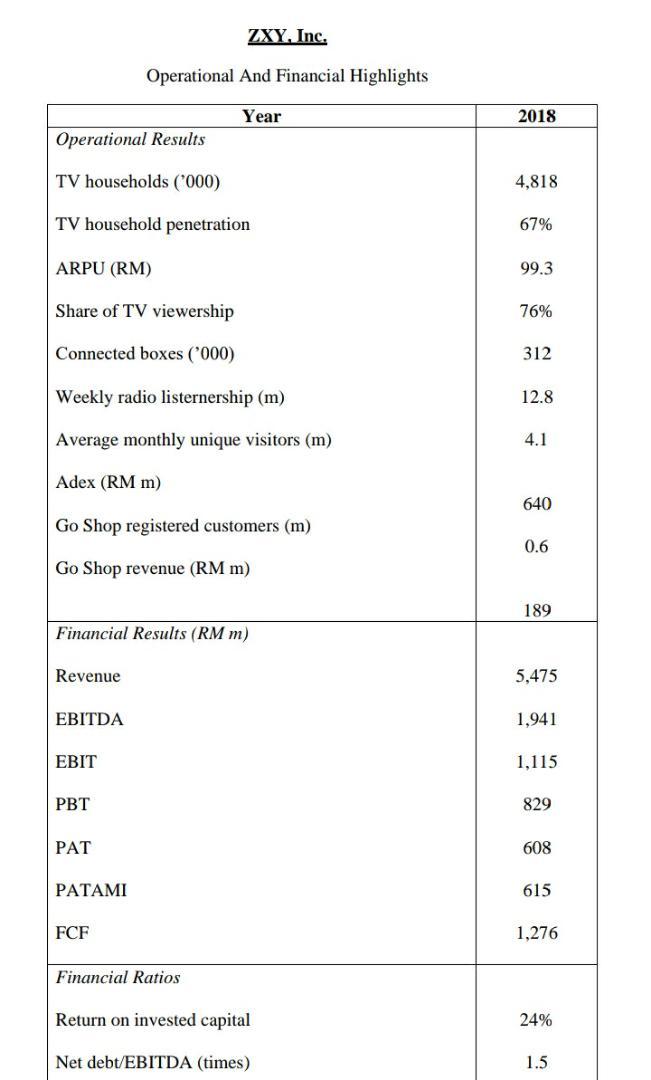
*Please provide solutions with formulas.
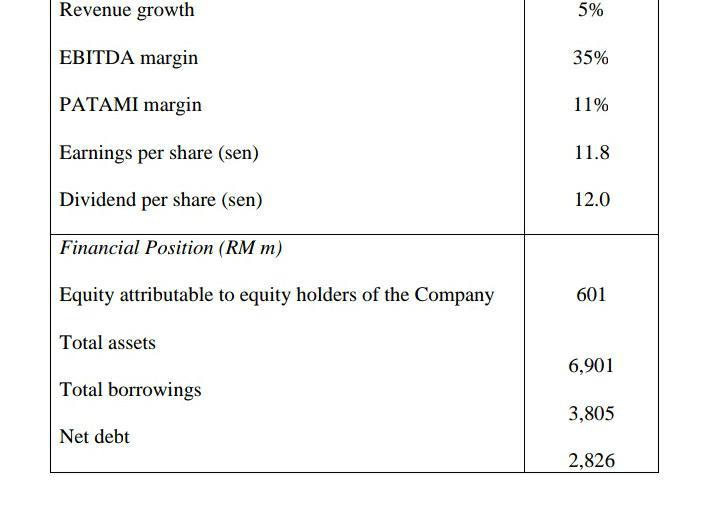
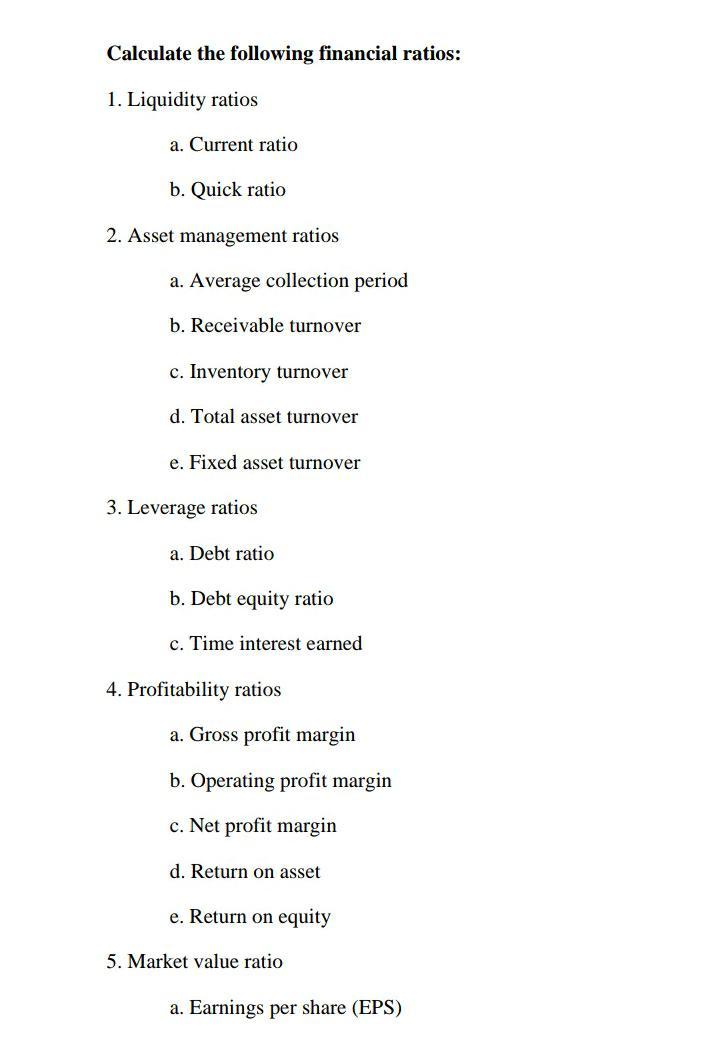
Tax liabilities 16,809 2,403,645 (362,533) Net Current Liabilities Non-Current Liabilities Payables 389,519 Derivative financial instruments 2,737 Borrowings 3,319,454 Deferred tax liabilities 79,263 3,790,973 653,329 NET ASSETS Capital and reserves attributable to equity holders of the Company Share capital 6,726,845 Share premium Exchange reserve 13,051 Capital reorganisation reserve (5,470,197) Hedging reserve (49,182) Fair value reserve (369) Share scheme reserve 10,362 Accumulated losses (576,918) 653,592 Non-controlling interests (263) TOTAL EQUITY 653,329 ZXY, Inc. Income Statements Year 2018 RM'000 Revenue 5,530,753 Cost of sales (3,269,886) Gross profit 2,260,867 Other operating income 20,377 Marketing and distribution costs (507,468) Administrative expenses (633,767) Finance income 171,522 Finance costs (236,772) (1,608) Share of post-tax results from investments accounted for using the equity method Impairment of investments accounted for using the equity method Profit before tax 1,073,151 Tax expense (309,175) Profit for the financial year 763,976 Attributable to: Equity holders of the Company 770,636 Non-controlling interests 16.660) 763,976 Earnings per share attributable to equity holders of the Company (RM): Basic 0.15 0.15 Diluted ZXY, Inc. Operational And Financial Highlights Year 2018 Operational Results TV households ('000) 4,818 TV household penetration 67% ARPU (RM) 99.3 Share of TV viewership 76% Connected boxes ('000) 312 Weekly radio listernership (m) 12.8 Average monthly unique visitors (m) 4.1 Adex (RM m) 640 Go Shop registered customers (m) 0.6 Go Shop revenue (RM m) 189 Financial Results (RM m) Revenue 5,475 EBITDA 1,941 EBIT 1,115 PBT 829 PAT 608 PATAMI 615 FCF 1,276 Financial Ratios Return on invested capital 24% Net debt/EBITDA (times) 1.5 Revenue growth 5% EBITDA margin 35% PATAMI margin 11% Earnings per share (sen) 11.8 Dividend per share (sen) 12.0 Financial Position (RM m) Equity attributable to equity holders of the Company 601 Total assets 6,901 Total borrowings 3,805 Net debt 2,826 Calculate the following financial ratios: 1. Liquidity ratios a. Current ratio b. Quick ratio 2. Asset management ratios a. Average collection period b. Receivable turnover c. Inventory turnover d. Total asset turnover e. Fixed asset turnover 3. Leverage ratios a. Debt ratio b. Debt equity ratio c. Time interest earned 4. Profitability ratios a. Gross profit margin b. Operating profit margin c. Net profit margin d. Return on asset e. Return on equity 5. Market value ratio a. Earnings per share (EPS)Step by Step Solution
There are 3 Steps involved in it
Step: 1

Get Instant Access to Expert-Tailored Solutions
See step-by-step solutions with expert insights and AI powered tools for academic success
Step: 2

Step: 3

Ace Your Homework with AI
Get the answers you need in no time with our AI-driven, step-by-step assistance
Get Started


