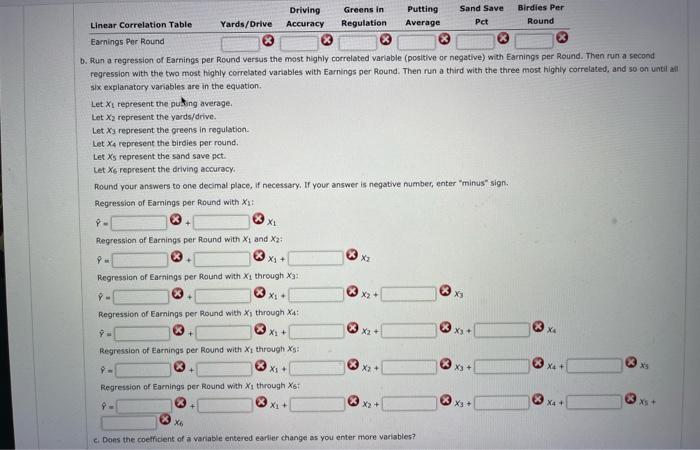
please provide the answer in the smae format is its shown in the second image
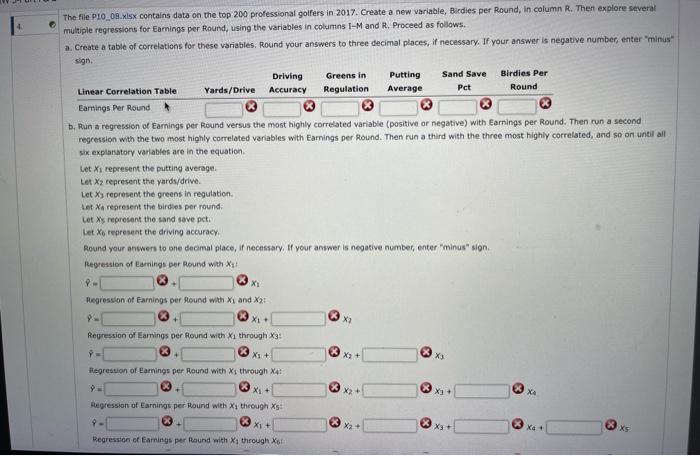
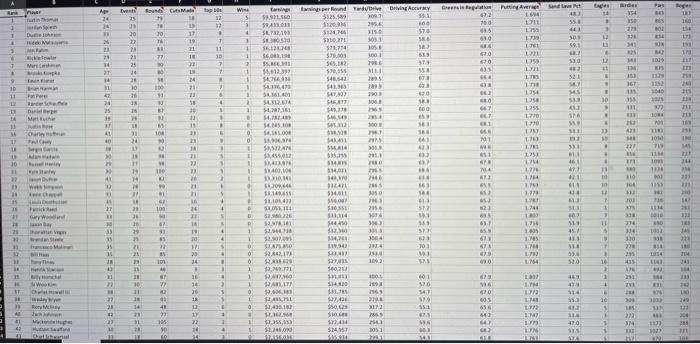
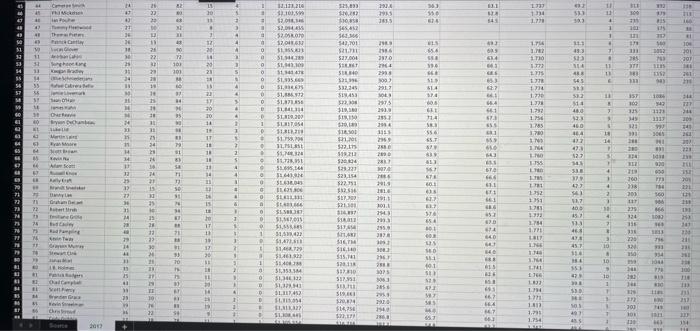
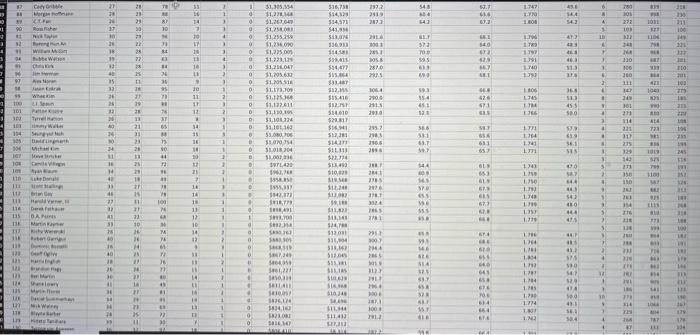
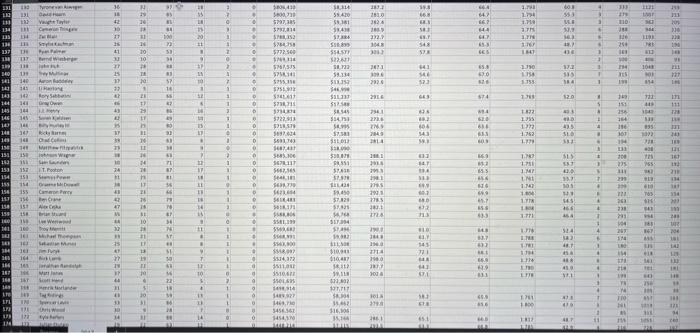
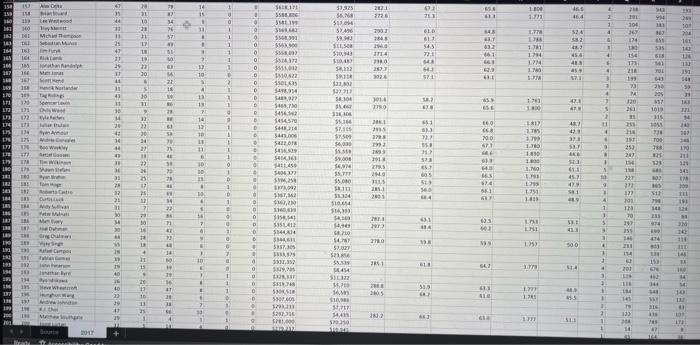
The file P10_09.xisx contains data on the top 200 professional golfers in 2017. Create a new variable, Birdies per Round, in column R. Then explore severat multiple regressions for Earnings per Round, using the variables in columns I-M and R. Proceed as follows. a. Create a table of correlations for these variables. Round your answers to three decimal places, if necessary. If your answer is negative number, enter "minus" rign. b. Run a regression of Earnings per Round versus the most highly correlated variable (positive of negative) witn earnings per round. Then run a second regression with the two most highly cocrelated variables with Earnings per hound. Then run a third with the three most highly correlated, and so on until all six explanatory vartables are in the equation. Let x1 represent the putting average. tet X2 represent the yards/drive. Let X3 represent the greens in regulation. Let xa represent the birdies per round: Let x5 represent the sand save pct. Let x6 represent the driving accuracy. Round your answers to one decimal place, if necessary, If your answer is negative number, enter "minus" sign. Regression of Eamings per llound with X1 : b. Run a regression of Eamings per Round versus the most highly correlated vanabie (posiove or negative) wus carrumy? ver munum. Then run a second regression with the two most highly correlated variables with Earnings per Round. Then run a third with the three most highly correlated, and se on until an six explanatory variables are in the equation. Let X1 represent the puling average, Let X2 represent the yards/drive. Let X represent the greens in regulation. Let x4 represent the biroles per round. Let X5 represent the sand save pct. Let XG represent the driving accuracy. Round your answers to one decimal place, if necessary. If your answer is negative number, enter "minus" sign. Regression of Eamings per Round with X2 : c. Dons the coetficient of a variable entered earlier change as you enter more variables? The file P10_09.xisx contains data on the top 200 professional golfers in 2017. Create a new variable, Birdies per Round, in column R. Then explore severat multiple regressions for Earnings per Round, using the variables in columns I-M and R. Proceed as follows. a. Create a table of correlations for these variables. Round your answers to three decimal places, if necessary. If your answer is negative number, enter "minus" rign. b. Run a regression of Earnings per Round versus the most highly correlated variable (positive of negative) witn earnings per round. Then run a second regression with the two most highly cocrelated variables with Earnings per hound. Then run a third with the three most highly correlated, and so on until all six explanatory vartables are in the equation. Let x1 represent the putting average. tet X2 represent the yards/drive. Let X3 represent the greens in regulation. Let xa represent the birdies per round: Let x5 represent the sand save pct. Let x6 represent the driving accuracy. Round your answers to one decimal place, if necessary, If your answer is negative number, enter "minus" sign. Regression of Eamings per llound with X1 : b. Run a regression of Eamings per Round versus the most highly correlated vanabie (posiove or negative) wus carrumy? ver munum. Then run a second regression with the two most highly correlated variables with Earnings per Round. Then run a third with the three most highly correlated, and se on until an six explanatory variables are in the equation. Let X1 represent the puling average, Let X2 represent the yards/drive. Let X represent the greens in regulation. Let x4 represent the biroles per round. Let X5 represent the sand save pct. Let XG represent the driving accuracy. Round your answers to one decimal place, if necessary. If your answer is negative number, enter "minus" sign. Regression of Eamings per Round with X2 : c. Dons the coetficient of a variable entered earlier change as you enter more variables