Please provide the cell information for the answer to each ratio. Thank you in advance. 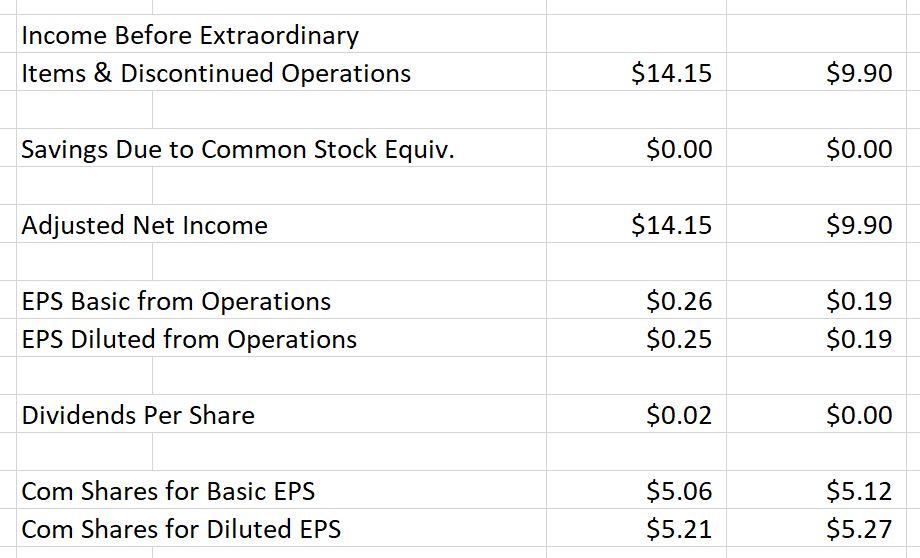
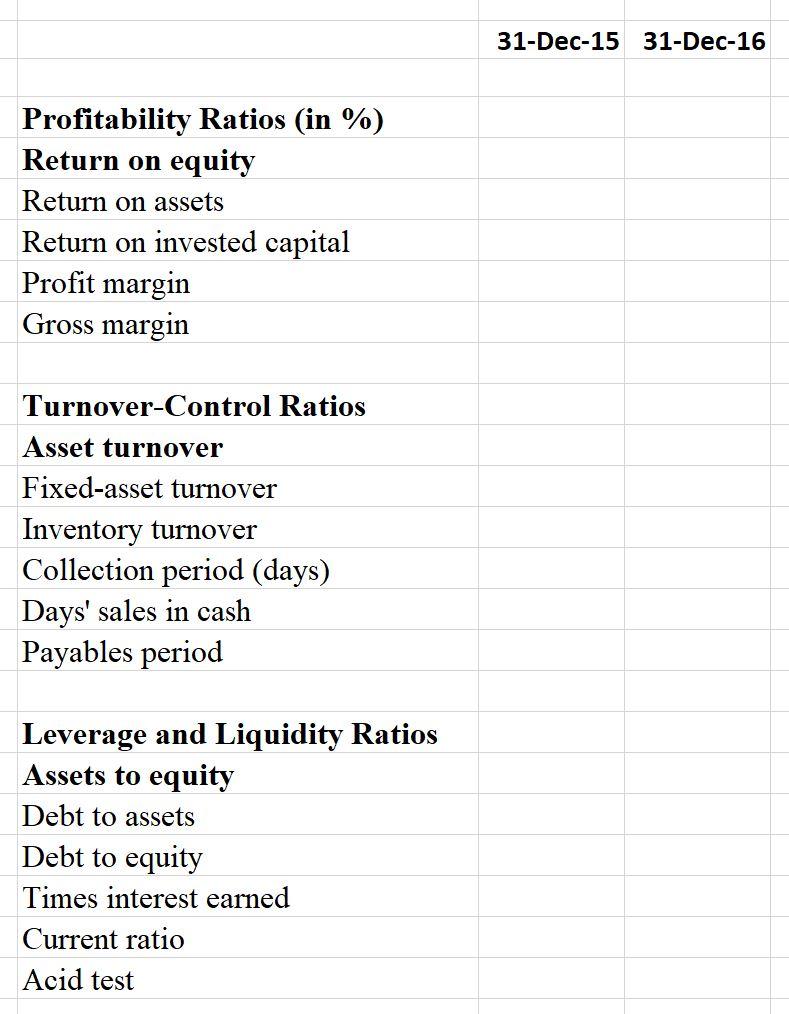
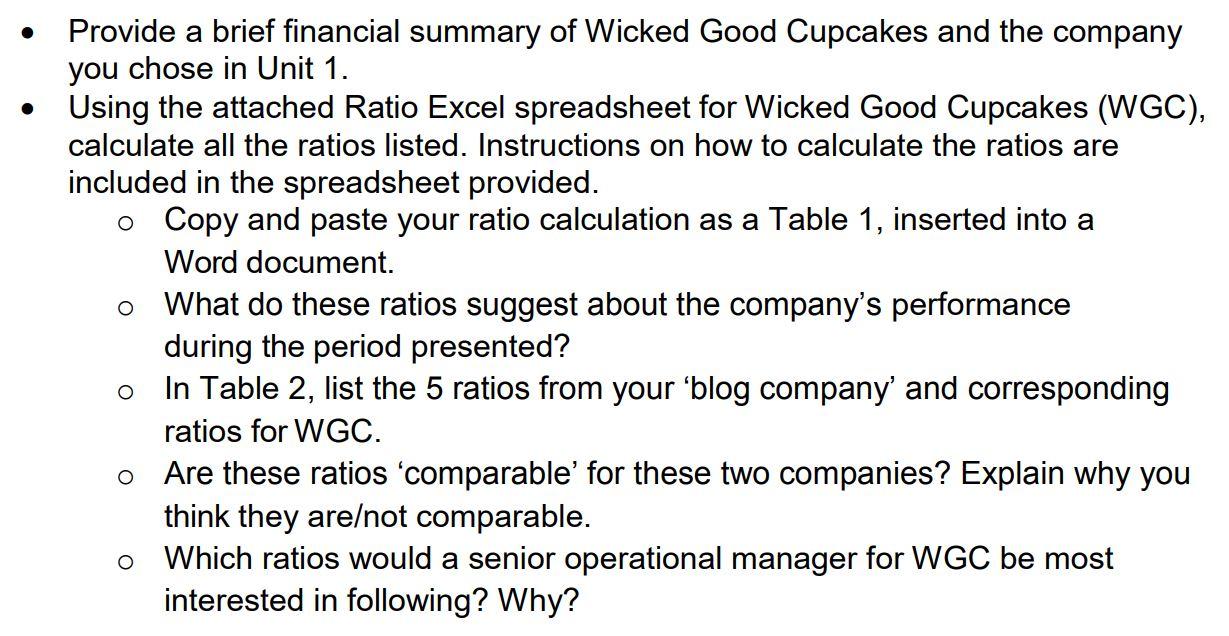
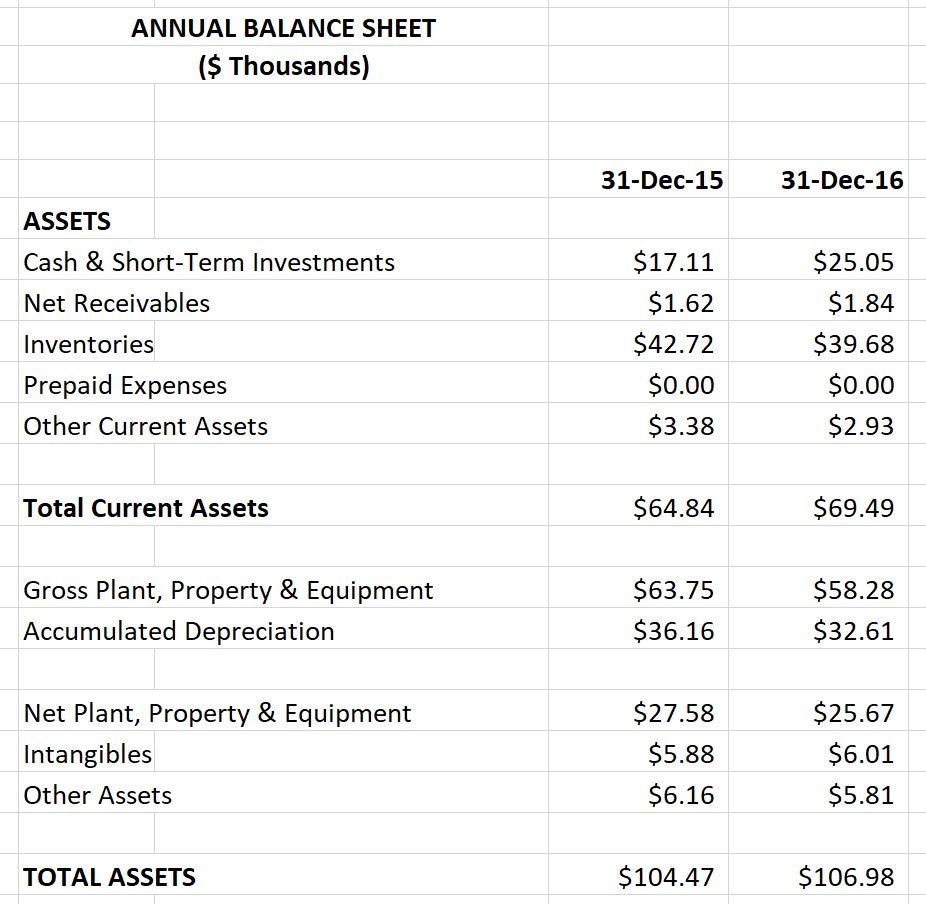
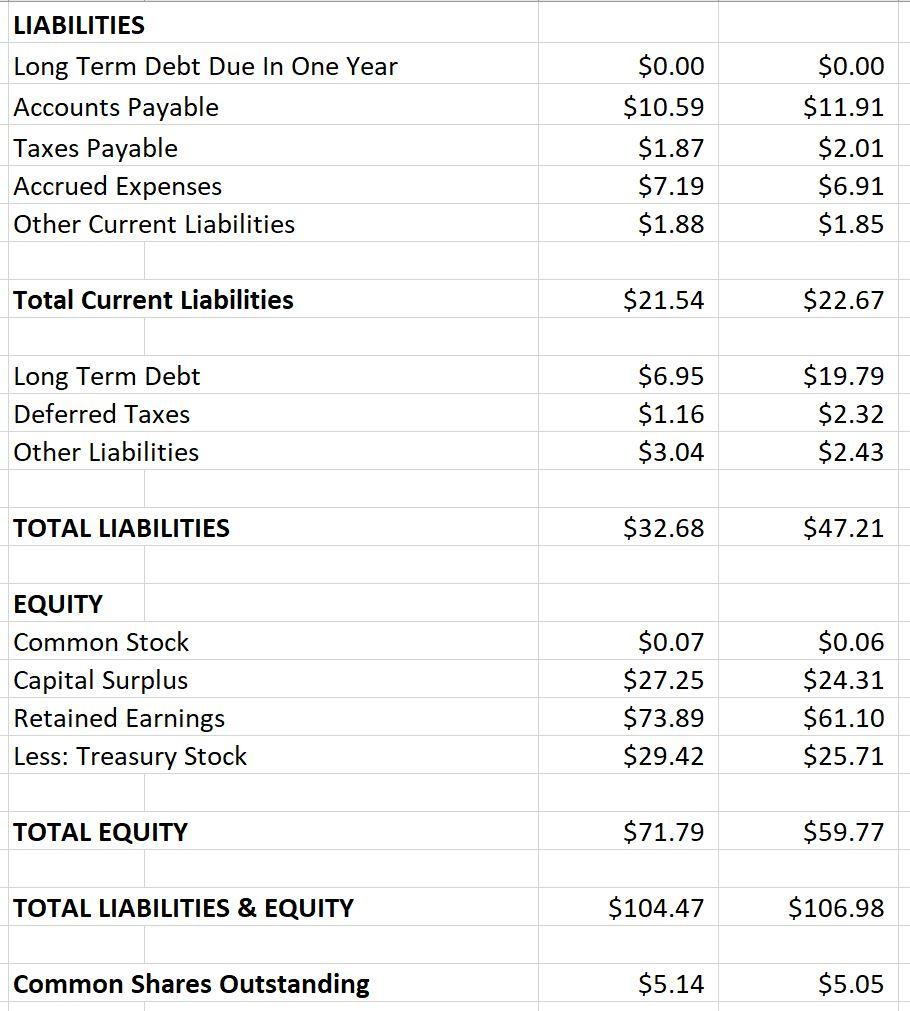
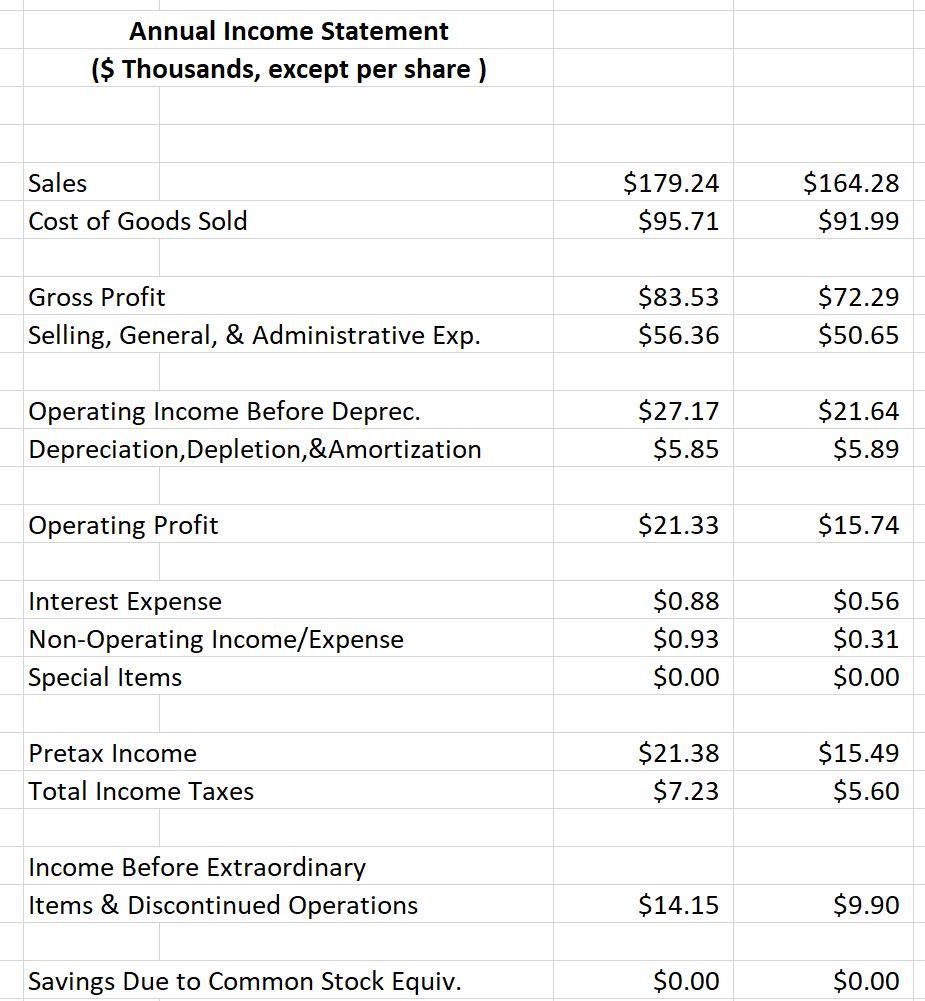
O Provide a brief financial summary of Wicked Good Cupcakes and the company you chose in Unit 1. Using the attached Ratio Excel spreadsheet for Wicked Good Cupcakes (WGC), calculate all the ratios listed. Instructions on how to calculate the ratios are included in the spreadsheet provided. o Copy and paste your ratio calculation as a Table 1, inserted into a Word document. What do these ratios suggest about the company's performance during the period presented? In Table 2, list the 5 ratios from your 'blog company' and corresponding ratios for WGC. Are these ratios 'comparable' for these two companies? Explain why you think they areot comparable. Which ratios would a senior operational manager for WGC be most interested in following? Why? O O O ANNUAL BALANCE SHEET ($ Thousands) 31-Dec-15 31-Dec-16 ASSETS Cash & Short-Term Investments Net Receivables Inventories Prepaid Expenses Other Current Assets $17.11 $1.62 $42.72 $0.00 $3.38 $25.05 $1.84 $39.68 $0.00 $2.93 Total Current Assets $64.84 $69.49 Gross Plant, Property & Equipment Accumulated Depreciation $63.75 $36.16 $58.28 $32.61 Net Plant, Property & Equipment Intangibles Other Assets $27.58 $5.88 $6.16 $25.67 $6.01 $5.81 TOTAL ASSETS $104.47 $106.98 LIABILITIES Long Term Debt Due In One Year Accounts Payable Taxes Payable Accrued Expenses Other Current Liabilities $0.00 $10.59 $1.87 $7.19 $1.88 $0.00 $11.91 $2.01 $6.91 $1.85 Total Current Liabilities $21.54 $22.67 Long Term Debt Deferred Taxes Other Liabilities $6.95 $1.16 $3.04 $19.79 $2.32 $2.43 TOTAL LIABILITIES $32.68 $47.21 EQUITY Common Stock Capital Surplus Retained Earnings Less: Treasury Stock $0.07 $27.25 $73.89 $29.42 $0.06 $24.31 $61.10 $25.71 TOTAL EQUITY $71.79 $59.77 TOTAL LIABILITIES & EQUITY $104.47 $106.98 Common Shares Outstanding $5.14 $5.05 Annual Income Statement ($ Thousands, except per share ) Sales $179.24 $95.71 $164.28 $91.99 Cost of Goods Sold Gross Profit Selling, General, & Administrative Exp. $83.53 $56.36 $72.29 $50.65 Operating Income Before Deprec. Depreciation, Depletion, & Amortization $27.17 $5.85 $21.64 $5.89 Operating Profit $21.33 $15.74 Interest Expense Non-Operating Income/Expense Special Items $0.88 $0.93 $0.00 $0.56 $0.31 $0.00 Pretax Income $21.38 $7.23 $15.49 $5.60 Total Income Taxes Income Before Extraordinary Items & Discontinued Operations $14.15 $9.90 Savings Due to Common Stock Equiv. $0.00 $0.00 Income Before Extraordinary Items & Discontinued Operations $14.15 $9.90 Savings Due to Common Stock Equiv. $0.00 $0.00 Adjusted Net Income $14.15 $9.90 EPS Basic from Operations EPS Diluted from Operations $0.26 $0.25 $0.19 $0.19 Dividends Per Share $0.02 $0.00 Com Shares for Basic EPS Com Shares for Diluted EPS $5.06 $5.21 $5.12 $5.27 31-Dec-15 31-Dec-16 Profitability Ratios (in %) Return on equity Return on assets Return on invested capital Profit margin Gross margin Turnover-Control Ratios Asset turnover Fixed-asset turnover Inventory turnover Collection period (days) Days' sales in cash Payables period Leverage and Liquidity Ratios Assets to equity Debt to assets Debt to equity Times interest earned Current ratio Acid test


