Please provide the following ratios
- Earnings per Share of Common Stock
- Current Ratio
- Gross Profit Rate
- Profit Margin
- Inventory Turnover
- Days in Inventory
- Accounts Receivable Turnover
- Average Collection Period
- Asset Turnover
- Return on Assets (ROA)
- Debt to assets Ratio
- Times Interest Earned Ratio
- Dividend Yield [For the purposes of this ratio, use Yahoo Finance to look up current dividend per share and stock price; just note the date that you looked up this information.]
- Return on Common Stockholders' Equity (ROE)
- Free cash flow
- Price-Earnings Ratio [For the purpose of this ratio, look up the market price per share as of September 28, 2017 for Apple Inc. and for Alphabet, Inc. use December 29, 2017]
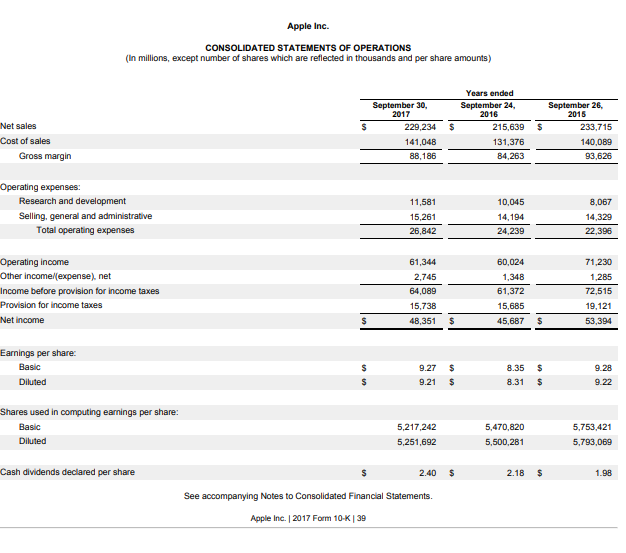
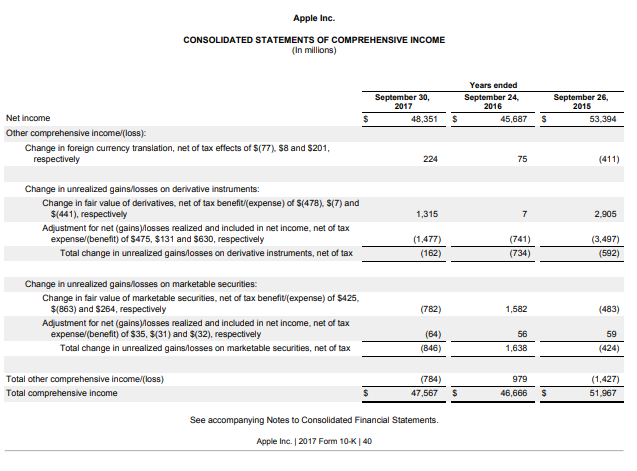
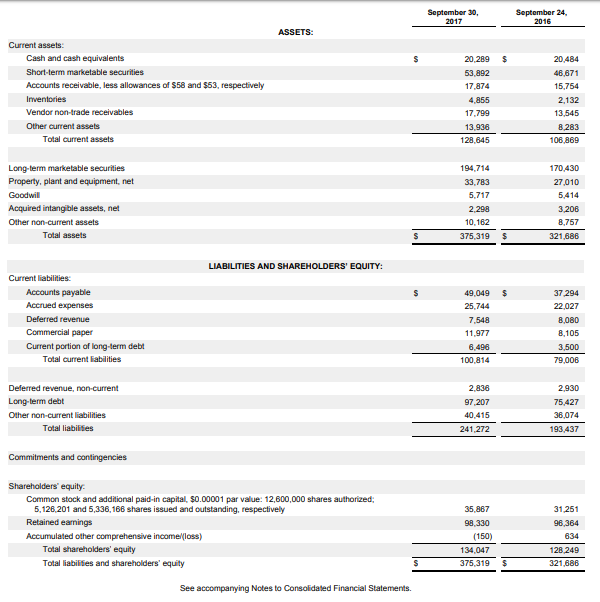
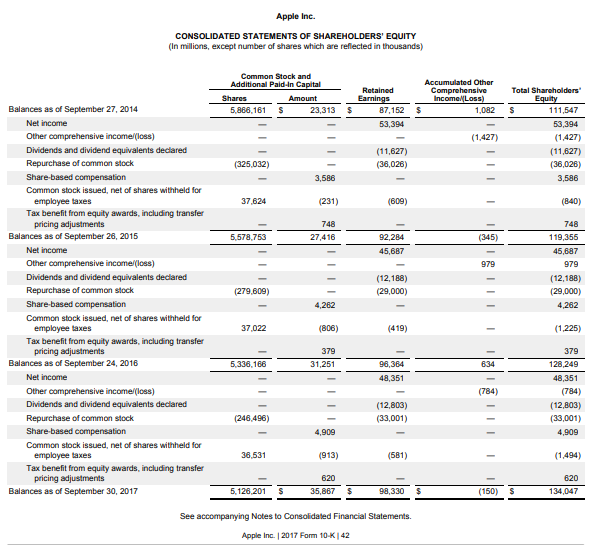
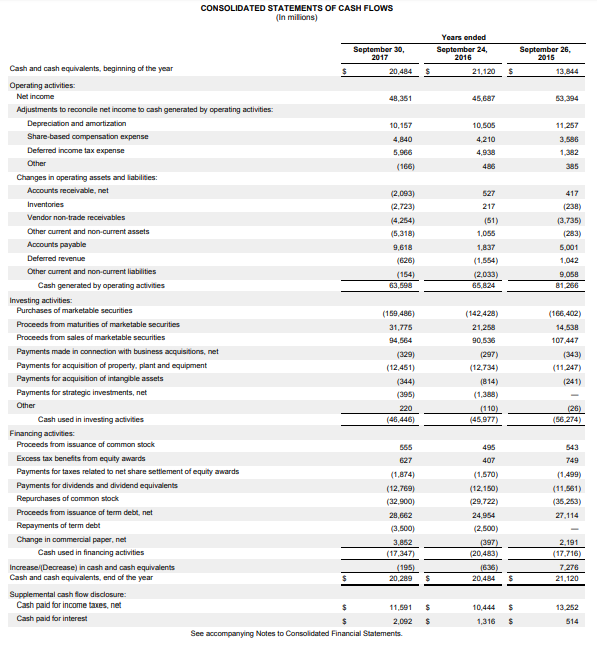
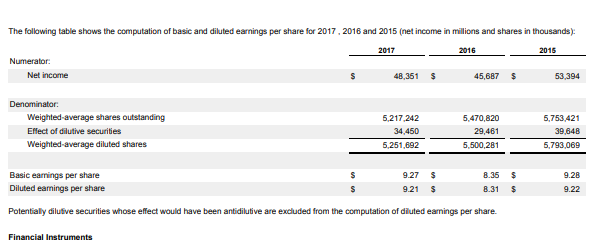
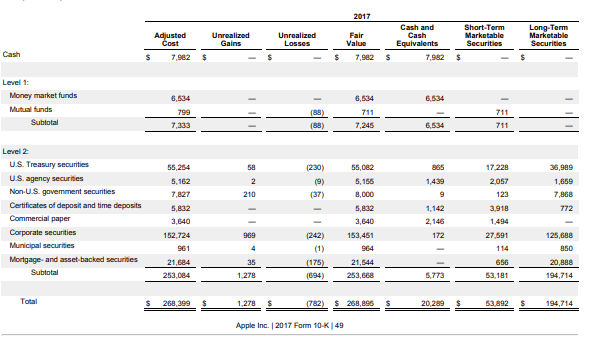
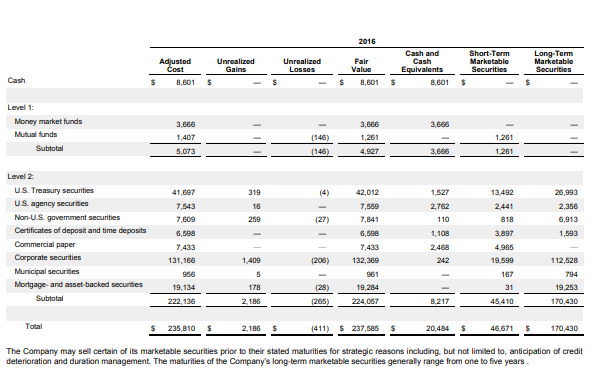
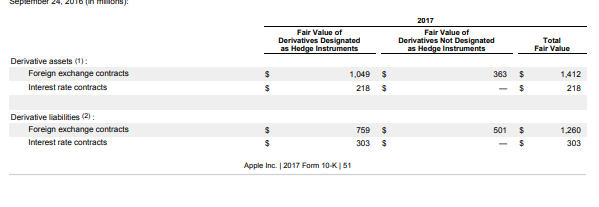
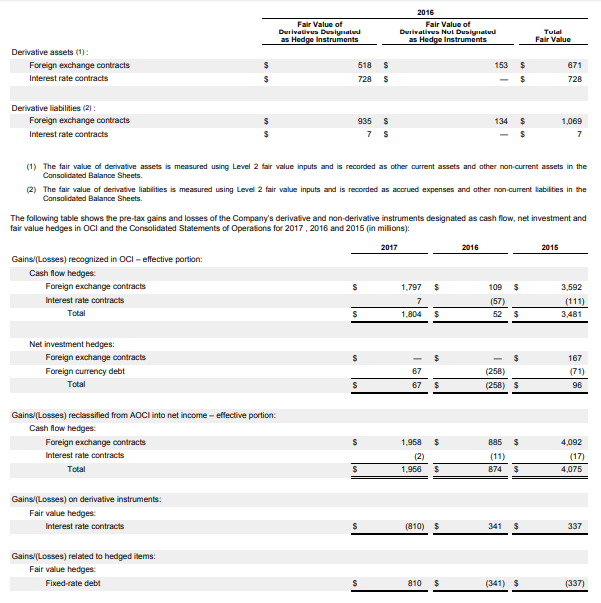
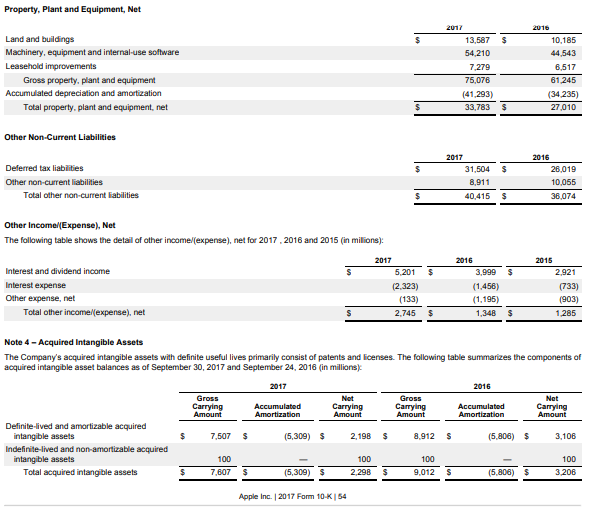
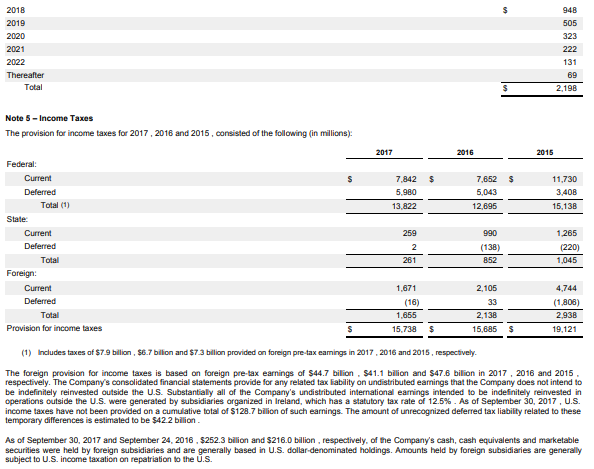
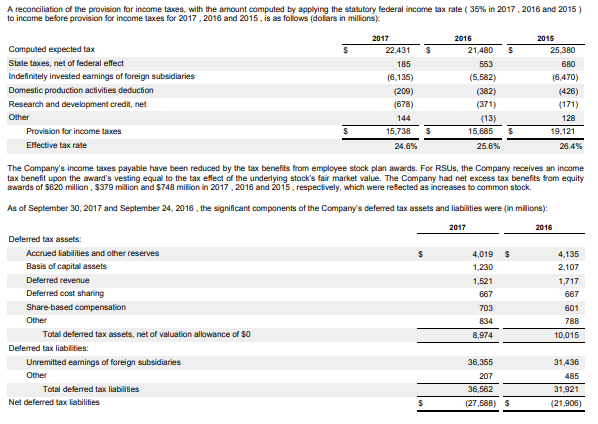
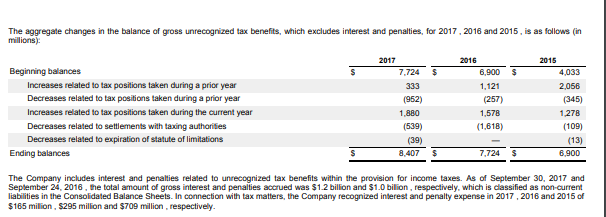
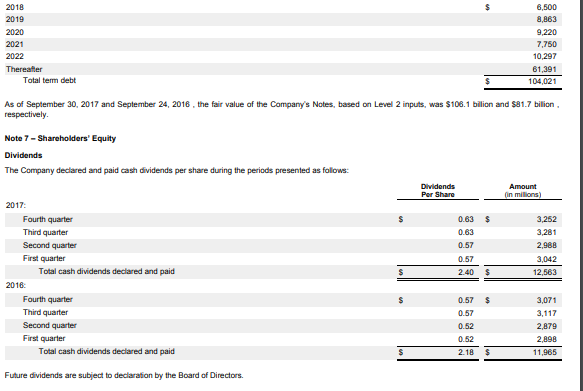
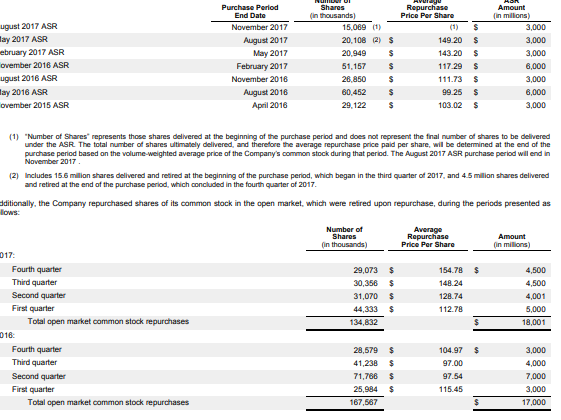
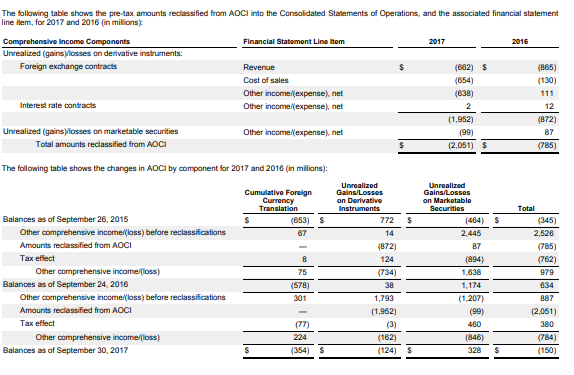
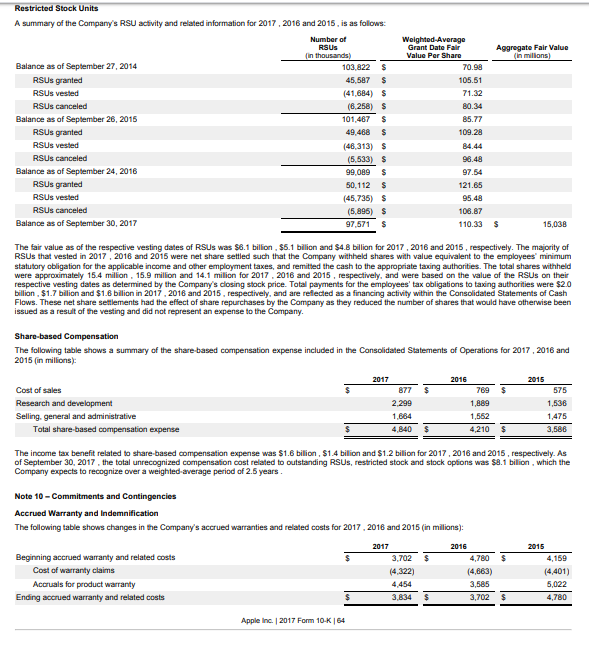
Apple Inc. CONSOLIDATED STATEMENTS OF OPERATIONS (in millions, except number of shares which are reflected in thousands and per share amounts) u $ Years ended September 24, 2016 215,639 131,376 84,263 Net sales Cost of sales Gross margin $ September 30, 2017 229,234 141,048 88,186 September 26, 2015 233,715 140,089 93,626 10,045 Operating expenses: Research and development Selling, general and administrative Total operating expenses 11,581 15,261 26,842 14,194 8,067 14,329 22,396 24,239 Operating income Other income (expense). net Income before provision for income taxes Provision for income taxes Net income 61,344 2.745 64,089 15,738 48,351 60,024 1,348 61,372 15,685 45,687 71,230 1,285 72,515 19,121 53,394 s $ $ Earnings per share: Basic Diluted $ 9.27 $ $ $ 8.35 8.31 9.28 9.22 9.21 $ Shares used in computing earnings per share: Basic Diluted 5,217.242 5,251,692 5,470,820 5,500,281 5,753,421 5,793,069 Cash dividends declared per share $ 2.40 $ 2.18 $ 1.98 See accompanying Notes to Consolidated Financial Statements. Apple Inc. 2017 Form 10-K 39 Apple Inc. CONSOLIDATED STATEMENTS OF COMPREHENSIVE INCOME (In millions) September 30, 2017 48,351 Years ended September 24, 2016 45,687 September 26, 2015 53.394 Net Income $ $ s Other comprehensive Income (loss): Change in foreign currency translation, net of tax effects of $(77). $8 and $201, respectively 224 75 (411) 1,315 7 2.905 Change in unrealized gans/losses on derivative Instruments: Change in fair value of derivatives, net of tax benefit/(expense) of $(478). $(7) and $(441), respectively Adjustment for net (gains losses realized and included in net income, net of tax expense/(benefit) of $475, $131 and $630, respectively Total change in unrealized gains losses on derivative Instruments, net of tax (1,477) (162) (741) (734) (3,497) (592) (782) 1,582 (483) Change in unrealized gains/losses on marketable securities: Change in fair value of marketable securities, net of tax benefiti(expense) of $425, $(863) and $264, respectively Adjustment for net (gains losses realized and included in net income, net of tax expense/benefit) of $35, $(31) and $(32), respectively Total change in unrealized gains losses on marketable securities, net of tax (64) 56 59 (424) (846) 1,638 Total other comprehensive income/loss) Total comprehensive income (784) 47,567 979 46,666 (1,427) 51.967 $ $ See accompanying Notes to Consolidated Financial Statements. Apple Inc. 2017 Form 10- K40 September 30, 2017 September 24, 2016 ASSETS: $ Current assets: Cash and cash equivalents Short-term marketable securities Accounts receivable, less allowances of $58 and $53, respectively Inventories Vendor non-trade receivables Other current assets Total current assets 20.289 53,892 17,874 4,855 17.799 13,936 128,645 20,484 46.671 15,754 2,132 13,545 8.283 106,869 170,430 27.010 5,414 Long-term marketable securities Property, plant and equipment, net Goodwil Acquired intangible assets, net Other non-current assets Total assets 194.714 33.783 5.717 2.298 10.162 375,319 3.206 8,757 321,686 LIABILITIES AND SHAREHOLDERS' EQUITY: S $ Current liabilities: Accounts payable Accrued expenses Deferred revenue Commercial paper Current portion of long-term debt Total current liabilities 49.049 25.744 7,548 11,977 6,496 100.814 37 294 22,027 8,080 8,105 3,500 79,006 Deferred revenue, non-current Long-term debt Other non-current liabilities Total liabilities 2,836 97 207 40,415 241,272 2.930 75.427 36,074 193,437 Commitments and contingencies Shareholders' equity Common stock and additional paid-in capital. $0.00001 par value: 12,600,000 shares authorized 5,126,201 and 5,336,166 shares issued and outstanding, respectively Retained earnings Accumulated other comprehensive incomel/loss) Total shareholders' equity Total liabilities and shareholders' equity 35.867 98,330 (150) 134,047 375,319 31.251 96,364 634 128 249 321.686 S $ See accompanying Notes to Consolidated Financial Statements. Apple Inc. CONSOLIDATED STATEMENTS OF SHAREHOLDERS' EQUITY (In millions, except number of shares which are reflected in thousands) Common Stock and Additional Pald-In Capital Shares Amount 5,866,161 23,313 Retained Earnings 87,152 53,394 Accumulated Other Comprehensive Income/Loss) 1,082 (1.427) Total Shareholders Equity 111,547 53,394 (1.427) (11,627) (36,026) 3,586 (11,627) (36,026) (325,032) 3,586 37.624 (231) (609) (840) 748 748 27,416 5,578,753 (345) 119,356 92,284 45,687 979 (12,188) (29,000) Balances as of September 27, 2014 Net income Other comprehensive income (loss) Dividends and dividend equivalents declared Repurchase of common stock Share-based compensation Common stock issued, net of shares withheld for employee taxes Tax benefit from equity awards, including transfer pricing adjustments Balances as of September 26, 2015 Net income Other comprehensive income (loss) Dividends and dividend equivalents declared Repurchase of common stock Share-based compensation Common stock issued, net of shares withheld for employee taxes Tax benefit from equity awards, including transfer pricing adjustments Balances as of September 24, 2016 Net income Other comprehensive income (loss) Dividends and dividend equivalents declared Repurchase of common stock Share-based compensation Common stock issued, net of shares withheld for employee taxes Tax benefit from equity awards, including transfer pricing adjustments Balances as of September 30, 2017 45,687 979 (12,188) (29,000) 4,282 (279.609) 4,262 37,022 (806) (419) (1,225) 379 31,251 5.336.168 96,364 634 48,351 (784) 379 128,249 48,351 (784) (12,803) (33,001) 4,909 (12,803) (33,001) (246,496) 4,909 36,631 (913) (581) (1.494) 620 35,867 620 134,047 5,126,201 S 98,330 (150) S See accompanying Notes to Consolidated Financial Statements. Apple Inc. 2017 Form 10-K42 CONSOLIDATED STATEMENTS OF CASH FLOWS (In millions) Years ended September 24, 2016 21.120 September 26, 2015 13.844 $ $ 45,687 53,394 10.505 11.257 4,210 4,938 3.586 1.382 385 495 527 217 (51) 1,055 417 (238) (3.735) (283) 5.001 1,837 1,042 (1.554) (2,033) 65,824 9.058 81.266 September 30, 2017 Cash and cash equivalents, beginning of the year $ 20,484 Operating activities: Net income 48,351 Adjustments to reconcile net income to cash generated by operating activities: Depreciation and amortization 10,157 Share-based compensation expense 4,840 Deferred income tax expense Other (166) Changes in operating assets and liabilities: Accounts receivable, net (2,093) Inventories (2.723) Vendor non-trade receivables Other current and non-current assets (5,318) Accounts payable 9,618 Deferred revenue (626) Other current and non-current liabilities (154) Cash generated by operating activities 63,598 Investing activities: Purchases of marketable securities (159,486) Proceeds from maturities of marketable securities 31.775 Proceeds from sales of marketable securities 94.564 Payments made in connection with business acquisitions, net (329) Payments for acquisition of property.plant and equipment (12,451) Payments for acquisition of intangible assets (344) Payments for strategic investments, net (395) Other 220 Cash used in investing activities (46,446) Financing activities: Proceeds from issuance of common stock 555 Excess tax benefits from equity awards 627 Payments for taxes related to net share settlement of equity awards (1.874) Payments for dividends and dividend equivalents (12.769) Repurchases of common stock (32.900) Proceeds from issuance of term debt, net 28,662 Repayments of term debt (3.500) Change in commercial paper.net 3,852 Cash used in financing activities (17.347) Increase/Decrease) in cash and cash equivalents (195) Cash and cash equivalents, end of the year $ 20,289 Supplemental cash flow disclosure: Cash paid for income taxes, net $ 11,591 Cash paid for interest 2,092 See accompanying Notes to Consolidated Financial Statements (142,428) 21,258 90,536 (297) (12,734) (814) (1,388) (110) (45.977) (166,402) 14.538 107 447 (343) (11.247) (26) (56.274) 495 543 407 749 (1.499) (11.561) (35.253) 27.114 (1.570) (12.150) (29,722) 24.954 (2.500) (397) (20,483) 1636) 20,484 2.191 (17.716) 7.276 21.120 $ $ 10.444 $ 13.252 $ 1,316 $ 514 The following table shows the computation of basic and diluted earnings per share for 2017, 2016 and 2015 (net income in millions and shares in thousands): 2017 2016 2015 Numerator: Net income S 48,351 $ 45,687 $ 53,394 Denominator: Weighted average shares outstanding Effect of dilutive Securities Weighted average diluted shares 5.217.242 34,450 5,251,692 5.470,820 29,461 5,500,281 5,753,421 39.64B 5.793,069 $ 9.27 $ 8.35 $ 9.28 Basic earnings per share Diluted earnings per share $ 9.21 $ 8.31 $ 9.22 Potentially dilutive securities whose effect would have been antidilutive are excluded from the computation of diluted earnings per share. Financial Instruments 2017 Adjusted Cost Unrealized Gains Unrealized Losses Fair Value Cash and Cash Equivalents 7.982 Short-Term Marketable Securities Long-Term Marketable Securities Cash $ 7,982 $ $ 7,902 $ $ 6,534 6,534 6.534 Level 1 Money market funds Mutual funds Subtotal 799 188 711 711 711 7,333 (88) 7,245 6.534 55,254 58 (230) 855 17 228 2 (9) (37) 1,439 9 2.057 123 55,082 5,155 8,000 5,832 3,640 36,989 1,659 7,968 210 Level 2 U.S. Treasury securities U.S. agency securities Non-U.S. government securities Certificates of deposit and time deposits Commercial paper Corporate securities Municipal securities Mortgage- and asset-backed securities Subtotal 5,162 7,827 5,832 3,640 772 1,142 2.146 3,918 1.494 969 172 27,591 152.724 961 153,451 964 4 114 (242) (1) (175) 1694) 125,688 850 20,888 194,714 35 656 21,684 253,084 21,544 253,668 1,278 5.773 53,181 Total 258 309 1.278 (782) $ 268,896 20.289 53.892 194,714 Apple Inc. 2017 Form 10- K49 2016 Adjusted Cost Unrealized Gains Unrealized Losses Fair Value 8,601 Cash and Cash Equivalents 8,601 Short-Term Marketable Securities Long-Term Marketable Securities Cash $ 8.601 $ $ Level 1: Money market funds Mutual funds Subtotal 3,666 3,666 1,407 3,666 1,261 1.261 (146) (146) 5,073 4,927 3,666 1.261 41,697 319 (4) 13.492 1,527 2.762 16 42,012 7,550 7,841 7,543 7,609 2.441 818 26,993 2,356 6,913 1,593 259 (27) 110 6,568 1,108 3.897 Level 2 U.S. Treasury securities U.S. agency securities Non-U.S. government securities Certificates of deposit and time deposits Commercial paper Corporate securities Municipal securities Mortgage and asset-backed securities Subtotal 7,433 132,369 2.468 242 4.965 19,599 1,409 (205) 6.598 7,433 131,166 956 19,134 222,136 167 961 19,284 112,528 794 19,253 170,430 178 31 (28) (265) 2.186 224,067 8,217 45.410 Total 235,810 2.186 (411) $ 237,585 20.484 46,671 170,430 The Company may sell certain of its marketable securities prior to their stated maturities for strategic reasons including, but not limited to, anticipation of credit deterioration and duration management. The maturities of the Company's long-term marketable securities generally range from one to five years. september 24, Fair Value of Derivatives Designated as Hedge Instruments 2017 Fair Value of Derivatives Not Designated as Hedge Instruments Total Fair Value Derivative assets (1): Foreign exchange contracts Interest rate contracts 363 $ 1,049 218 $ $ 1,412 218 $ Derivative liabilities (2) Foreign exchange contracts Interest rate contracts 501 759 $ 3035 $ $ 1.260 303 Apple Inc. 2017 Form 10-K 51 Fair Value of Duivatlus Dalya as Hedge Instruments 2016 Fair Value of Duivatives Nut Duslyna as Hedge Instruments Tulal Fair Value Derivative assets (1): Foreign exchange contracts Interest rate contracts S 153 $ 518 728 671 728 S $ Derivative liabilities (2) Foreign exchange contracts Interest rate contracts 134 935 $ 7 $ $ $ 1,069 7 (1) The fair value of derivative assets is measured using Level 2 fair value inputs and is recorded as other current assets and other non-current assets in the Consolidated Balance Sheets. (2) The fair value of derivative liabilities is measured using Level 2 fair value inputs and is recorded as accrued expenses and other non-current liabilities in the Consolidated Balance Sheets. The following table shows the pre-tax gains and losses of the Company's derivative and non-derivative instruments designated as cash flow, net investment and fair value hedges in OCI and the Consolidated Statements of Operations for 2017, 2016 and 2015 (in millions): 2017 2016 2015 Gains/Losses) recognized in OCI - effective portion: Cash flow hedges Foreign exchange contracts Interest rate contracts Total 1.797 $ 109 $ 3,592 7 1.804 (57) 52 (111) 3,481 $ $ Net investment hedges: Foreign exchange contracts Foreign currency debt Total 67 (258) (258) $ 167 (71) 96 S 67 Gains/(Losses) reclassified from AOCl into net income - effective portion: Cash flow hedges: Foreign exchange contracts Interest rate contracts Total 1,958 885 $ (11) 874 4,092 (17) 4,075 1.958 $ $ Gains/(Losses) on derivative instruments: Fair value hedges: Interest rate contracts (810) $ 341 $ 337 Gains (Losses) related to hedged items: Fair value hedges: Fixed-rate debt 810 $ (337) Property. Plant and Equipment, Net 2017 2016 13.587 54,210 Land and buildings Machinery, equipment and internal use software Leasehold improvements Gross property, plant and equipment Accumulated depreciation and amortization Total property, plant and equipment, net 7.279 75,076 (41.293) 33,783 10,185 44,543 6.517 61 245 (34 235) 27,010 Other Non-Current Liabilities Deferred tax liabilities Other non-current liabilities Total other non-current liabilities 2017 31.504 8,911 2016 26.019 10.065 36,074 $ 40,415 Other Income (Expense), Net The following table shows the detail of other income (expense), net for 2017 2016 and 2015 (in millions): 2016 3,999 $ $ Interest and dividend income Interest expense Other expense, net Total other incomel expense), net 2017 5.201 (2.323) (133) 2.745 (1,456) (1.195) 1,348 2015 2.921 (733) (903) 1.285 $ $ Note 4 - Acquired Intangible Assets The Company's acquired intangible assets with definite useful lives primarily consist of patents and licenses. The following table summarizes the components of acquired intangible asset balances as of September 30, 2017 and September 24, 2016 (in Millions) 2017 2016 Net Gross Carrying Amount Accumulated Amortization Carrying Amount Gross Carrying Amount Accumulated Amortization Net Carrying Amount $ 7,507 $ (5,309) $ 2,198 8.912 $ (5,806) $ 3.106 Definite-lived and amortizable acquired intangible assets Indefinite-lived and non-amortizable acquired intangible assets Total acquired intangible assets 100 7.807 100 2,298 (5,309) 100 9.012 100 3.206 $ (5.806) Apple Inc. 2017 Form 10-K 54 2018 2019 2020 2021 2022 Thereafter Total 948 505 323 222 131 69 2,198 Note 5-Income Taxes The provision for income taxes for 2017, 2016 and 2015, consisted of the following (in millions): 2017 2016 2015 $ $ $ 7.842 5,980 13.822 7,652 5,043 12,695 11,730 3,408 15,138 259 Federal: Current Deferred Total (1) State: Current Deferred Total Foreign: Current Deferred Total Provision for income taxes 2 261 990 (138) 852 1.265 (220 1,045 1.671 (16) 1,655 15.738 2.105 33 2,138 4,744 (1.808 2,938 S 15,685 $ 19,121 (1) Includes taxes of $7.9 billion, $6.7 bilion and $7.3 billion provided on foreign pre-tax eamings in 2017 2016 and 2015, respectively The foreign provision for income taxes is based on foreign pre-tax earnings of $44.7 billion. $41.1 bilion and $47.8 billion in 2017, 2016 and 2015 respectively. The Company's consolidated financial statements provide for any related tax liability on undistributed earnings that the Company does not intend to be indefinitely reinvested outside the U.S. Substantially all of the Company's undistributed international earnings intended to be indefinitely reinvested in operations outside the U.S. were generated by subsidiaries organized in Ireland, which has a statutory tax rate of 12.5%. As of September 30, 2017. U.S. income taxes have not been provided on a cumulative total of $128.7 bilion of such earnings. The amount of unrecognized deferred tax liability related to these temporary differences is estimated to be $42.2 billion As of September 30, 2017 and September 24, 2016 $252.3 billion and $216.0 billion, respectively, of the Company's cash, cash equivalents and marketable securities were held by foreign subsidiaries and are generally based in U.S. dollar-denominated holdings. Amounts held by foreign subsidiaries are generally subject to U.S. income taxation on repatriation to the U.S. A reconciliation of the provision for income taxes, with the amount computed by applying the statutory federal income tax rate ( 35% in 2017 2016 and 2015) to income before provision for income taxes for 2017 2016 and 2015, is as follows (dollars in millions 2017 22,431 s 2016 21.480 $ 185 553 Computed expected tax State taxes, net of federal effect Indefinitely invested earnings of foreign subsidiaries Domestic production activities deduction Research and development credit, net Other Provision for income taxes Effective tax rate (6.135) (209) (678) 144 15.738 24.6% (5,582) (382) (371) (13) 15.685 25.6% 2015 25.380 6B0 (6.470) (426) (171) 128 19.121 28.4% $ The Company's income taxes payable have been reduced by the tax benefits from employee stock plan awards. For RSUS, the Company receives an income tax benefit upon the award's vesting equal to the tax effect of the underlying stock's fair market value. The Company had net excess tax benefits from equity awards of $620 million, $379 million and $748 million in 2017 2016 and 2015, respectively, which were reflected as increases to common stock. As of September 30, 2017 and September 24, 2016, the significant components of the Company's deferred tax assets and liabilities were (in milions): 2017 2016 s Deferred tax assets: Accrued liabilities and other reserves Basis of capital assets Deferred revenue Deferred cost sharing Share-based compensation Other Total deferred tax assets, net of valuation allowance of $0 Deferred tax liabilities: Unremitted earnings of foreign subsidiaries Other Total deferred tax liabilities Net deferred tax liabilities 4,019 1,230 1,521 667 703 834 8,974 4,135 2.107 1.717 667 601 788 10,015 36,355 207 36,562 (27.588) $ 31,436 485 31,921 (21.908) The aggregate changes in the balance of gross unrecognized tax benefits, which excludes interest and penalties, for 2017, 2016 and 2015, is as follows (in millions): 2017 2016 2015 Beginning balances 7.724 6.900 $ 4,033 Increases related to tax positions taken during a prior year 333 1,121 2.056 Decreases related to tax positions taken during a prior year (257) (345) Increases related to tax positions taken during the current year 1,880 1,578 1.278 Decreases related to settlements with taxing authorities (539) (1.618) (109) Decreases related to expiration of statute of limitations (13) Ending balances 8,407 7,724 6.900 (952) (39) The Company includes interest and penalties related to unrecognized tax benefits within the provision for income taxes. As of September 30, 2017 and September 24, 2016, the total amount of gross interest and penalties accrued was $1.2 billion and $1.0 bilion, respectively, which is classified as non-current liabilities in the Consolidated Balance Sheets. In connection with tax matters, the Company recognized interest and penalty expense in 2017, 2016 and 2015 of $165 million, 5295 million and $709 million, respectively. 2017 2016 (Continued Malurile Amount in million Effective Interest Rate Amount in mo) Effective Interest Rate 2019 500 1.39% 2000 500 2002 1.000 Second quarter 2017 dance of 100 Floating- Floating-ands Flowing red Faste 1.50% na Feste 100% Feste 2.500 Fate 3.000% 1.51% 181% 15 2019 500 2010 1.000 1515 2002 1900 1.80 2004 1.790 2.11% 2.25% 2007 Fate 4.250% 2047 1.000 4.26% Second quarter 2017 dance of 10 bilion Fase 4.300% 2047 1.000 4.3% 1 2010 500 1.38% 2002 70 1.06% Third quierter 2017 dettiin ST. bilion Floating and Floatings Fate 1.800 de Fade 2.300%.net Festate 20% Fate 3.2009 2000 1.000 2002 1.000 2004 1.790 2.25% 2007 2000 2.43% Third quarter 2017 out-denominated att since of 2.5 billion Fate 0.875% Fondate 1.37% 200 1489 03 2009 1.469 3.37% Third quarter 2017 datt inse 1.0 ben: Fate 3.000% 2007 1 000 3.0 Fourth quarter 2017 Canadian dollardaneminded Getting of $25 Fondale 2.513% 2004 2017 2.8% 2019 1.000 2002 1 000 192% Fourth quarter 2017 dance of $5.0 billion Flat 1.500%. Fate 2.00% Festate 2.900% Feate 3.790% Totalment 2007 2 000 2.55% 2047 1.000 3.78% 78,334 Untertad premium.count and ecobi, nat Hedge accounting fair values Less: Current portion of long-termatt Total long term 717 3.500) 16400 9T 207 75,427 2018 2019 2020 2021 2022 Thereafter Total term debt 6,500 8,863 9,220 7.750 10,297 61,391 104,021 As of September 30, 2017 and September 24, 2018. the fair value of the Company's Notes, based on Level 2 inputs, was $106.1 bilion and $81.7 bilion. respectively Note 7 - Shareholders' Equity Dividends The Company declared and paid cash dividends per share during the periods presented as follows: Dividends Per Share Amount (in milions) 0.63 $ 0.63 0.57 3,252 3,281 2,988 3,042 12,563 0.57 2.40 $ 2017: Fourth quarter Third quarter Second quarter First quarter Total cash dividends declared and paid 2018 Fourth quarter Third quarter Second quarter First quarter Total cash dividends declared and paid $ $ 0.57 0.57 0.52 0.52 2.18 3,071 3,117 2,879 2,898 11,965 Future dividends are subject to declaration by the Board of Directors. Repurchase Price Per Share $ $ ugust 2017 ASR May 2017 ASR ebruary 2017 ASR ovember 2016 ASR ugust 2016 ASR lay 2016 ASR ovember 2015 ASR Purchase Period End Date November 2017 August 2017 May 2017 February 2017 November 2016 August 2016 April 2016 Shares (in thousands) 15,069 (1) 20.108 (2) $ 20.949 $ 51,157 $ 26.850 $ 60,452 $ 29.122 $ 149.20 143.20 117 29 111.73 99.25 103.02 $ $ $ $ $ Amount in milions) 3,000 3,000 3,000 6,000 3,000 6,000 3,000 (1) "Number of Shares" represents those shares delivered at the beginning of the purchase period and does not represent the final number of shares to be delivered under the ASR The total number of shares ultimately delivered and therefore the average repurchase price paid per share, will be determined at the end of the purchase period based on the volume-weighted average price of the Company's common stock during that period. The August 2017 ASR purchase period will end in November 2017 (2) Includes 15.6 milion shares delivered and retired at the beginning of the purchase period, which began in the third quarter of 2017 and 4.5 million shares delivered and retired at the end of the purchase period, which concluded in the fourth quarter of 2017 dditionally, the Company repurchased shares of its common stock in the open market, which were retired upon repurchase, during the periods presented as lows: Number of Shares in thousands) Average Repurchase Price Per Share Amount (in millions) $ 29,073 $ 30,356 $ 31,070 $ 44,333 $ 134,832 154.78 148.24 128.74 112.78 4,500 4,500 4,001 5,000 18,001 $ 017: Fourth quarter Third quarter Second quarter First quarter Total open market common stock repurchases 016 Fourth quarter Third quarter Second quarter First quarter Total open market common stock repurchases $ 28,579 $ 41,238 $ 71,766 $ 25,984 $ 167,567 104.97 97.00 97.54 115.45 3,000 4,000 7,000 3,000 17,000 $ The following table shows the pre-tax amounts reclassified from AOCI into the Consolidated Statements of Operations, and the associated financial statement line item, for 2017 and 2016 (in Millions Financial Statement Line Item 2017 2016 Comprehensive Income Components Unrealized (gainslosses on derivative instruments: Foreign exchange contracts Revenue Cost of sales Other income expense). net Other income expense). net (682) $ (654) (638) 2 (1,952) (865) (130) 111 Interest rate contracts 12 Unrealized (gains Mosses on marketable securities Total amounts reclassified from AOCI Other income expense), net (99) (872) 87 (785) (2,051) $ The following table shows the changes in AOCI by component for 2017 and 2016 (in milions): Cumulative Foreign Currency Translation (653) S 67 Balances as of September 28, 2015 Other comprehensive income foss) before reclassifications Amounts reclassified from AOCI Tax effect Other comprehensive income loss) Balances as of September 24, 2018 Other comprehensive income (loss) before reclassifications Amounts reclassified from AOCI Tax effect Other comprehensive income (loss) Balances as of September 30, 2017 B Unrealized Gains/Losses on Marketable Securities (484) $ 2.445 87 (894) 1,638 1.174 (1.207) (99) 480 (846) 328 Total (345) 2.526 (785) (762) 979 634 Unrealized Gains/Losses on Derivative Instruments 772 14 (872) 124 (734) 38 1.793 (1.962) (3) (162) (124) 75 (578) 301 887 (77) 224 (354) S (2,061) 380 (784) (150) Restricted Stock Units A summary of the Company's RSU activity and related information for 2017, 2016 and 2015, is as follows: Aggregate Fair Value (in millions] Balance as of September 27, 2014 RSUS granted RSUS vested RSUS canceled Balance as of September 26, 2015 RSUs granted RSUS vested RSUS canceled Balance as of September 24, 2016 RSUS granted RSUS vested RSUS canceled Balance as of September 30, 2017 Number of RSUS in thousands) 103,822 $ 45,587 $ (41.684) S (6.258) $ 101,467 $ 49,468 $ (46,313) S (5.533) $ 99,089 50.112 $ (45.735) $ (5.895) $ 97,571 $ Weighted Average Grant Date Fair Value Per Share 70.98 105.51 71.32 B0.34 85.77 109.28 B4.44 98.48 97.54 121.65 95.48 106.87 110.33 $ $ 15,038 The fair value as of the respective vesting dates of RSUS was $8.1 billion $6.1 billion and $4.8 billion for 2017, 2016 and 2015, respectively. The majority of RSUS that vested in 2017 2016 and 2015 were net share settled such that the Company withheld shares with value equivalent to the employees' minimum statutory obligation for the applicable income and other employment taxes, and remitted the cash to the appropriate taxing authorities. The total shares withheld were approximately 15.4 million, 15.9 million and 14.1 million for 2017 2016 and 2015, respectively, and were based on the value of the RSUS on their respective vesting dates as determined by the Company's closing stock price. Total payments for the employees' tax obligations to taxing authorities were $2.0 billion $1.7 bilion and $1.8 billion in 2017 2016 and 2015, respectively, and are reflected as a financing activity within the Consolidated Statements of Cash Flows. These net share settlements had the effect of share repurchases by the Company as they reduced the number of shares that would have otherwise been issued as a result of the vesting and did not represent an expense to the Company. Share-based Compensation The following table shows a summary of the share-based compensation expense included in the Consolidated Statements of Operations for 2017, 2016 and 2015 (in millions): 2017 2016 $ Cost of sales Research and development Selling general and administrative Total share-based compensation expense 877 2.299 1,664 4,840 769 1,889 1,552 4,210 2015 575 1,536 1,475 3,586 $ $ $ The income tax benefit related to share-based compensation expense was $1.6 billion, $1.4 billion and $1.2 billion for 2017, 2016 and 2015, respectively. As of September 30, 2017, the total unrecognized compensation cost related to outstanding RSUS, restricted stock and stock options was $8.1 billion, which the Company expects to recognize over a weighted average period of 2.5 years Note 10 - Commitments and Contingencies Accrued Warranty and Indemnification The following table shows changes in the Company's accrued warranties and related costs for 2017 2018 and 2015 (in milions): 2016 $ Beginning accrued warranty and related costs Cost of warranty claims Accruals for product warranty Ending accrued warranty and related costs 2017 3,702 (4.322) 4.454 3.834 4,780 (4,863) 3,585 3,702 2015 4,159 (4,401) 5,022 4,780 $ Apple Inc. 2017 Form 10-K 64