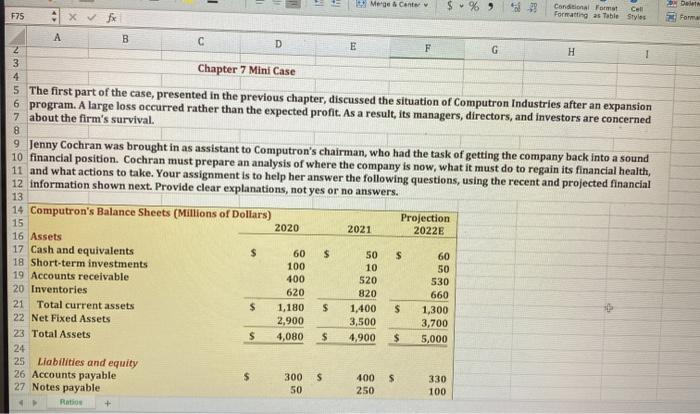
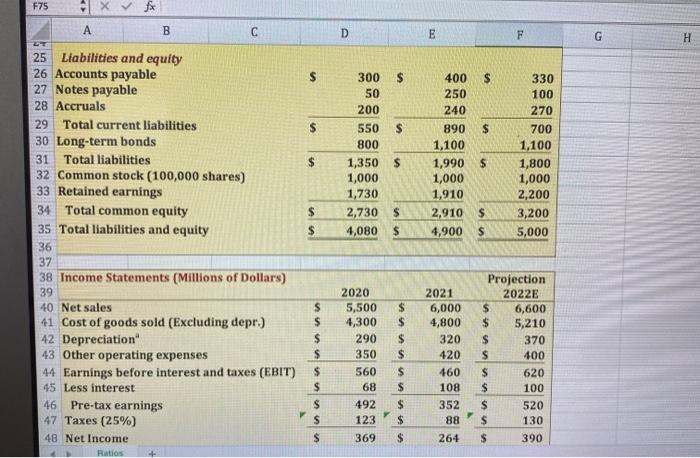
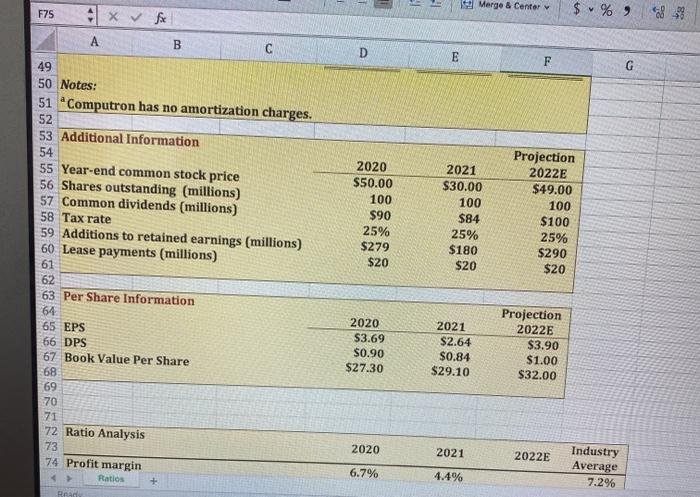
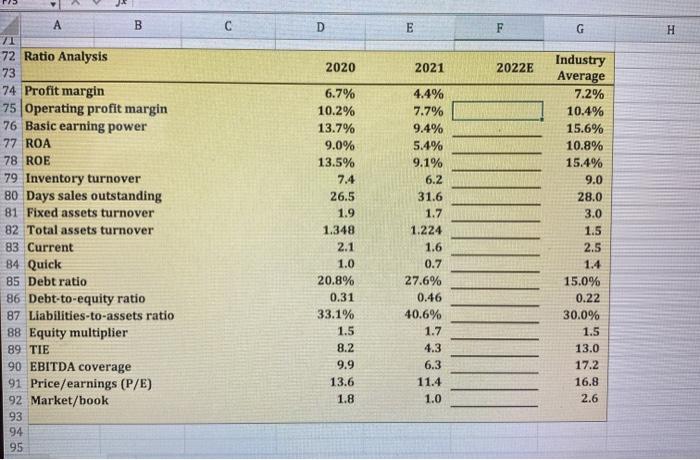
Please provide the formulas required to satisfy the blanks in the "2022E" column, thank you!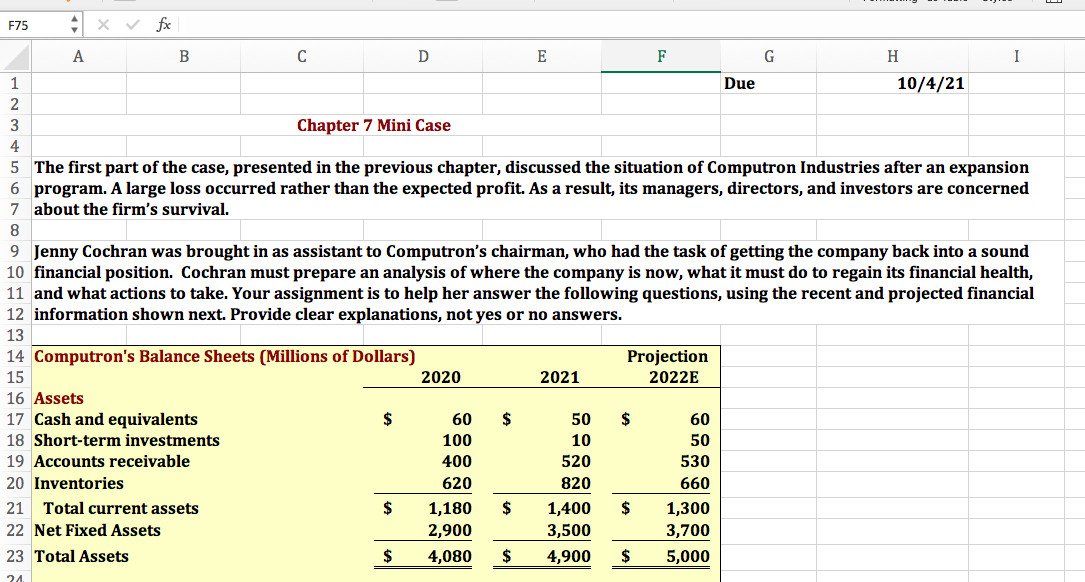
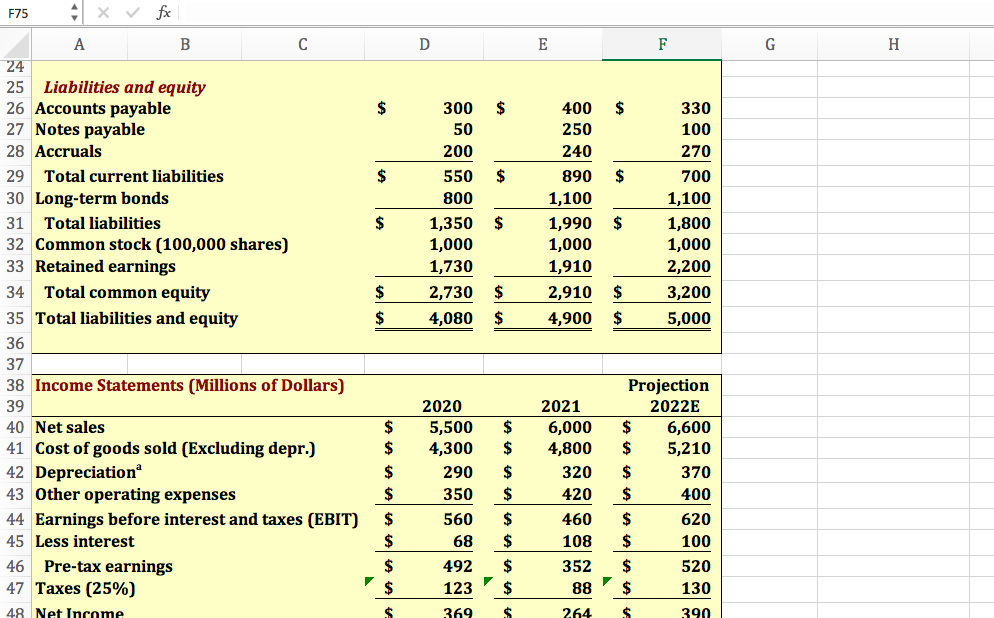
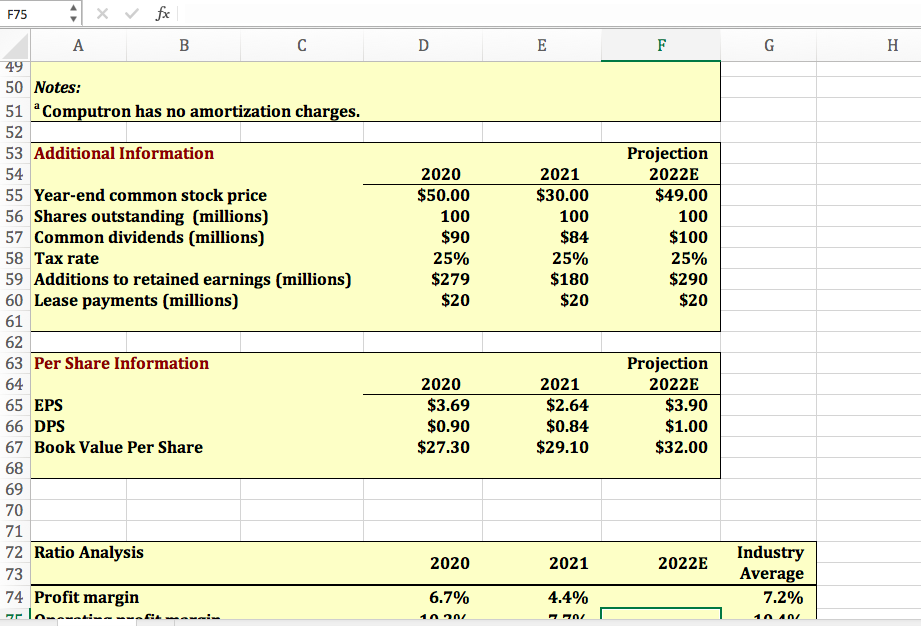
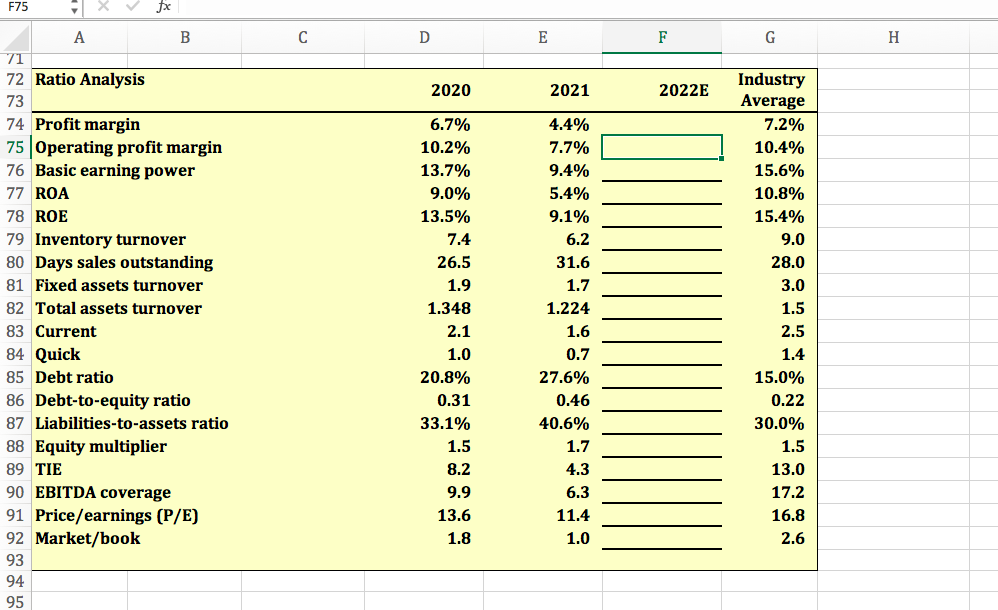
F75 4 x fx G A B D E H I 1 Due 10/4/21 2 3 Chapter 7 Mini Case 4 5 The first part of the case, presented in the previous chapter, discussed the situation of Computron Industries after an expansion 6 program. A large loss occurred rather than the expected profit. As a result, its managers, directors, and investors are concerned 7 about the firm's survival. 8 9 Jenny Cochran was brought in as assistant to Computron's chairman, who had the task of getting the company back into a sound 10 financial position. Cochran must prepare an analysis of where the company is now, what it must do to regain its financial health, 11 and what actions to take. Your assignment is to help her answer the following questions, using the recent and projected financial 12 information shown next. Provide clear explanations, not yes or no answers. 13 14 Computron's Balance Sheets (Millions of Dollars) Projection 15 2020 2022E 16 Assets 17 Cash and equivalents $ $ 50 $ 60 18 Short-term investments 100 10 50 19 Accounts receivable 400 520 530 20 Inventories 620 820 660 21 Total current assets $ 1,180 $ 1,400 $ 1,300 22 Net Fixed Assets 2,900 3,500 3,700 23 Total Assets $ 4,080 $ 4,900 $ 5,000 2021 24 D E F G H $ $ $ 330 300 50 200 400 250 240 100 $ $ $ $ $ $ 550 800 1,350 1,000 1,730 2,730 4,080 890 1,100 1,990 1,000 1,910 2,910 4,900 F75 x fx A B C 24 25 Liabilities and equity 26 Accounts payable 27 Notes payable 28 Accruals 29 Total current liabilities 30 Long-term bonds 31 Total liabilities 32 Common stock (100,000 shares) 33 Retained earnings 34 Total common equity 35 Total liabilities and equity 36 37 38 Income Statements (Millions of Dollars) 39 40 Net sales 41 Cost of goods sold (Excluding depr.) 42 Depreciation 43 Other operating expenses 44 Earnings before interest and taxes (EBIT) 45 Less interest 46 Pre-tax earnings 47 Taxes (25%) 48. Net Income 270 700 1,100 1,800 1,000 2,200 3,200 5,000 $ $ $ $ $ $ $ $ $ $ $ $ $ 2020 5,500 4,300 290 350 560 68 492 123 369 $ Projection 2022E $ 6,600 $ 5,210 $ 370 $ 400 $ 620 $ 100 $ 520 $ 130 2021 6,000 4,800 320 420 460 108 352 88 264 $ $ $ $ $ $ $ $ $ $ 390 F75 D E F G H H # xv fx A B C 49 50 Notes: 51 "Computron has no amortization charges. 52 53 Additional Information 54 55 Year-end common stock price 56 Shares outstanding (millions) 57 Common dividends (millions) 58 Tax rate 59 Additions to retained earnings (millions) 60 Lease payments (millions) 61 62 63 Per Share Information 64 65 EPS 66 DPS 67 Book Value Per Share 2020 $50.00 100 $90 25% $279 $20 2021 $30.00 100 $84 25% $180 $20 Projection 2022E $49.00 100 $100 25% $290 $20 2020 $3.69 $0.90 $27.30 2021 $2.64 $0.84 $29.10 Projection 2022E $3.90 $1.00 $32.00 68 69 70 71 72 Ratio Analysis 73 74 Profit margin zelo ----------- 2020 2021 2022E Industry Average 7.2% 6.7% 4.4% 7701 11A / F75 fx D E F G H 2020 2021 2022E 6.7% 10.2% 13.7% 9.0% A B 71 72 Ratio Analysis 73 74 Profit margin 75 Operating profit margin 76 Basic earning power 77 ROA 78 ROE 79 Inventory turnover 80 Days sales outstanding 81 Fixed assets turnover 82 Total assets turnover 83 Current 84 Quick 85 Debt ratio 86 Debt-to-equity ratio 87 Liabilities-to-assets ratio 88 Equity multiplier 89 TIE 90 EBITDA coverage 91 Price/earnings (P/E) 92 Market/book 93 94 95 13.5% 7.4 26.5 1.9 1.348 2.1 1.0 20.8% 0.31 33.1% 1.5 8.2 9.9 13.6 1.8 4.4% 7.7% 9.4% 5.4% 9.1% 6.2 31.6 1.7 1.224 1.6 0.7 27.6% 0.46 40.6% 1.7 4.3 6.3 11.4 1.0 Industry Average 7.2% 10.4% 15.6% 10.8% 15.4% 9.0 28.0 3.0 1.5 2.5 1.4 15.0% 0.22 30.0% 1.5 13.0 17.2 16.8 2.6 Det Pomme . A Mege & Center $ % Conditional Format Call Formatting as Table Styles F75 Xfx B C D E 2 F G H 3 Chapter 7 Mini Case 4 5 The first part of the case, presented in the previous chapter, discussed the situation of Computron Industries after an expansion 6 program. A large loss occurred rather than the expected profit. As a result, its managers, directors, and investors are concerned 7 about the firm's survival. 8 9 Jenny Cochran was brought in as assistant to Computron's chairman, who had the task of getting the company back into a sound 10 financial position. Cochran must prepare an analysis of where the company is now, what it must do to regain its financial health, 11 and what actions to take. Your assignment is to help her answer the following questions, using the recent and projected financial 12 information shown next. Provide clear explanations, not yes or no answers. 13 14 Computron's Balance Sheets (Millions of Dollars) Projection 15 2020 2021 2022 16 Assets 17 Cash and equivalents $ 60 $ 50 s 60 18 Short-term investments 100 10 50 19 Accounts receivable 400 520 530 20 Inventories 620 820 660 21 Total current assets $ 1,180 s 1,400 $ 1,300 22 Net Fixed Assets 2,900 3,500 3,700 23 Total Assets $ 4,080 $ 4,900 $ 5,000 24 25 Liabilities and equity 26 Accounts payable $ 300 S 400 330 27 Notes payable 50 250 100 Ratio F75 1 X fx B C D E F G H $ $ $ 300 $ 50 200 550 $ 800 1,350 $ 1,000 1,730 2,730 $ 4,080 $ 400 250 240 890 1,100 1,990 1,000 1,910 2,910 4,900 $ 330 100 270 700 1,100 1,800 1,000 2,200 3,200 5,000 $ S $ $ S 25 Liabilities and equity 26 Accounts payable 27 Notes payable 28 Accruals 29 Total current liabilities 30 Long-term bonds 31 Total liabilities 32 Common stock (100,000 shares) 33 Retained earnings 34 Total common equity 35 Total liabilities and equity 36 37 38 Income Statements (Millions of Dollars) 39 40. Net sales 41 Cost of goods sold (Excluding depr.) 42 Depreciation 43 Other operating expenses 44 Earnings before interest and taxes (EBIT) 45 Less interest 46 Pre-tax earnings 47 Taxes (25%) 48 Net Income Ratios S $ $ $ $ $ $ S 2020 5,500 4,300 290 350 560 68 492 123 $ $ $ $ $ $ $ $ $ 2021 6,000 4,800 320 420 460 108 352 88 264 Projection 2022E $ 6,600 $ 5,210 $ 370 $ 400 $ 620 $ 100 $ 520 s 130 $ 390 $ 369 11 Mergo & Center F75 x fx $ %, A B C D E G 49 50 Notes: 51 "Computron has no amortization charges. 52 53 Additional Information 54 55 Year-end common stock price 56 Shares outstanding (millions) 57 Common dividends (millions) 58 Tax rate 59 Additions to retained earnings (millions) 60 Lease payments (millions) 61 62 63 Per Share Information 64 65 EPS 66 DPS 67 Book Value Per Share 68 69 70 71 72 Ratio Analysis 73 74 Profit margin 2020 $50.00 100 $90 25% $279 $20 2021 $30.00 100 $84 25% $180 $20 Projection 2022E $49.00 100 $100 25% $290 $20 2020 $3.69 $0.90 $27.30 2021 $2.64 $0.84 $29.10 Projection 2022E $3.90 $1.00 $32.00 2020 2021 2022E Industry Average 7.2% 6.7% Ratios 4.4% Read C D E F G H 2020 2021 2022E A B 71 72 Ratio Analysis 73 74 Profit margin 75 Operating profit margin 76 Basic earning power 77 ROA 78 ROE 79 Inventory turnover 80 Days sales outstanding 81 Fixed assets turnover 82 Total assets turnover 83 Current 84 Quick 85 Debt ratio 86 Debt-to-equity ratio 87 Liabilities-to-assets ratio 88 Equity multiplier 89 TIE 90 EBITDA coverage 91 Price/earnings (P/E) 92 Market/book 93 94 95 6.7% 10.2% 13.7% 9.0% 13.5% 7.4 26.5 1.9 1.348 2.1 1.0 20.8% 0.31 33.1% 1.5 8.2 9.9 13.6 1.8 4.4% 7.7% 9.4% 5.4% 9.1% 6.2 31.6 1.7 1.224 1.6 0.7 27.6% 0.46 40.6% 1.7 4.3 6.3 11.4 Industry Average 7.2% 10.4% 15.6% 10.8% 15.4% 9.0 28.0 3.0 1.5 2.5 1.4 15.0% 0.22 30.0% 1.5 13.0 17.2 16.8 2.6 1.0 F75 4 x fx G A B D E H I 1 Due 10/4/21 2 3 Chapter 7 Mini Case 4 5 The first part of the case, presented in the previous chapter, discussed the situation of Computron Industries after an expansion 6 program. A large loss occurred rather than the expected profit. As a result, its managers, directors, and investors are concerned 7 about the firm's survival. 8 9 Jenny Cochran was brought in as assistant to Computron's chairman, who had the task of getting the company back into a sound 10 financial position. Cochran must prepare an analysis of where the company is now, what it must do to regain its financial health, 11 and what actions to take. Your assignment is to help her answer the following questions, using the recent and projected financial 12 information shown next. Provide clear explanations, not yes or no answers. 13 14 Computron's Balance Sheets (Millions of Dollars) Projection 15 2020 2022E 16 Assets 17 Cash and equivalents $ $ 50 $ 60 18 Short-term investments 100 10 50 19 Accounts receivable 400 520 530 20 Inventories 620 820 660 21 Total current assets $ 1,180 $ 1,400 $ 1,300 22 Net Fixed Assets 2,900 3,500 3,700 23 Total Assets $ 4,080 $ 4,900 $ 5,000 2021 24 D E F G H $ $ $ 330 300 50 200 400 250 240 100 $ $ $ $ $ $ 550 800 1,350 1,000 1,730 2,730 4,080 890 1,100 1,990 1,000 1,910 2,910 4,900 F75 x fx A B C 24 25 Liabilities and equity 26 Accounts payable 27 Notes payable 28 Accruals 29 Total current liabilities 30 Long-term bonds 31 Total liabilities 32 Common stock (100,000 shares) 33 Retained earnings 34 Total common equity 35 Total liabilities and equity 36 37 38 Income Statements (Millions of Dollars) 39 40 Net sales 41 Cost of goods sold (Excluding depr.) 42 Depreciation 43 Other operating expenses 44 Earnings before interest and taxes (EBIT) 45 Less interest 46 Pre-tax earnings 47 Taxes (25%) 48. Net Income 270 700 1,100 1,800 1,000 2,200 3,200 5,000 $ $ $ $ $ $ $ $ $ $ $ $ $ 2020 5,500 4,300 290 350 560 68 492 123 369 $ Projection 2022E $ 6,600 $ 5,210 $ 370 $ 400 $ 620 $ 100 $ 520 $ 130 2021 6,000 4,800 320 420 460 108 352 88 264 $ $ $ $ $ $ $ $ $ $ 390 F75 D E F G H H # xv fx A B C 49 50 Notes: 51 "Computron has no amortization charges. 52 53 Additional Information 54 55 Year-end common stock price 56 Shares outstanding (millions) 57 Common dividends (millions) 58 Tax rate 59 Additions to retained earnings (millions) 60 Lease payments (millions) 61 62 63 Per Share Information 64 65 EPS 66 DPS 67 Book Value Per Share 2020 $50.00 100 $90 25% $279 $20 2021 $30.00 100 $84 25% $180 $20 Projection 2022E $49.00 100 $100 25% $290 $20 2020 $3.69 $0.90 $27.30 2021 $2.64 $0.84 $29.10 Projection 2022E $3.90 $1.00 $32.00 68 69 70 71 72 Ratio Analysis 73 74 Profit margin zelo ----------- 2020 2021 2022E Industry Average 7.2% 6.7% 4.4% 7701 11A / F75 fx D E F G H 2020 2021 2022E 6.7% 10.2% 13.7% 9.0% A B 71 72 Ratio Analysis 73 74 Profit margin 75 Operating profit margin 76 Basic earning power 77 ROA 78 ROE 79 Inventory turnover 80 Days sales outstanding 81 Fixed assets turnover 82 Total assets turnover 83 Current 84 Quick 85 Debt ratio 86 Debt-to-equity ratio 87 Liabilities-to-assets ratio 88 Equity multiplier 89 TIE 90 EBITDA coverage 91 Price/earnings (P/E) 92 Market/book 93 94 95 13.5% 7.4 26.5 1.9 1.348 2.1 1.0 20.8% 0.31 33.1% 1.5 8.2 9.9 13.6 1.8 4.4% 7.7% 9.4% 5.4% 9.1% 6.2 31.6 1.7 1.224 1.6 0.7 27.6% 0.46 40.6% 1.7 4.3 6.3 11.4 1.0 Industry Average 7.2% 10.4% 15.6% 10.8% 15.4% 9.0 28.0 3.0 1.5 2.5 1.4 15.0% 0.22 30.0% 1.5 13.0 17.2 16.8 2.6 Det Pomme . A Mege & Center $ % Conditional Format Call Formatting as Table Styles F75 Xfx B C D E 2 F G H 3 Chapter 7 Mini Case 4 5 The first part of the case, presented in the previous chapter, discussed the situation of Computron Industries after an expansion 6 program. A large loss occurred rather than the expected profit. As a result, its managers, directors, and investors are concerned 7 about the firm's survival. 8 9 Jenny Cochran was brought in as assistant to Computron's chairman, who had the task of getting the company back into a sound 10 financial position. Cochran must prepare an analysis of where the company is now, what it must do to regain its financial health, 11 and what actions to take. Your assignment is to help her answer the following questions, using the recent and projected financial 12 information shown next. Provide clear explanations, not yes or no answers. 13 14 Computron's Balance Sheets (Millions of Dollars) Projection 15 2020 2021 2022 16 Assets 17 Cash and equivalents $ 60 $ 50 s 60 18 Short-term investments 100 10 50 19 Accounts receivable 400 520 530 20 Inventories 620 820 660 21 Total current assets $ 1,180 s 1,400 $ 1,300 22 Net Fixed Assets 2,900 3,500 3,700 23 Total Assets $ 4,080 $ 4,900 $ 5,000 24 25 Liabilities and equity 26 Accounts payable $ 300 S 400 330 27 Notes payable 50 250 100 Ratio F75 1 X fx B C D E F G H $ $ $ 300 $ 50 200 550 $ 800 1,350 $ 1,000 1,730 2,730 $ 4,080 $ 400 250 240 890 1,100 1,990 1,000 1,910 2,910 4,900 $ 330 100 270 700 1,100 1,800 1,000 2,200 3,200 5,000 $ S $ $ S 25 Liabilities and equity 26 Accounts payable 27 Notes payable 28 Accruals 29 Total current liabilities 30 Long-term bonds 31 Total liabilities 32 Common stock (100,000 shares) 33 Retained earnings 34 Total common equity 35 Total liabilities and equity 36 37 38 Income Statements (Millions of Dollars) 39 40. Net sales 41 Cost of goods sold (Excluding depr.) 42 Depreciation 43 Other operating expenses 44 Earnings before interest and taxes (EBIT) 45 Less interest 46 Pre-tax earnings 47 Taxes (25%) 48 Net Income Ratios S $ $ $ $ $ $ S 2020 5,500 4,300 290 350 560 68 492 123 $ $ $ $ $ $ $ $ $ 2021 6,000 4,800 320 420 460 108 352 88 264 Projection 2022E $ 6,600 $ 5,210 $ 370 $ 400 $ 620 $ 100 $ 520 s 130 $ 390 $ 369 11 Mergo & Center F75 x fx $ %, A B C D E G 49 50 Notes: 51 "Computron has no amortization charges. 52 53 Additional Information 54 55 Year-end common stock price 56 Shares outstanding (millions) 57 Common dividends (millions) 58 Tax rate 59 Additions to retained earnings (millions) 60 Lease payments (millions) 61 62 63 Per Share Information 64 65 EPS 66 DPS 67 Book Value Per Share 68 69 70 71 72 Ratio Analysis 73 74 Profit margin 2020 $50.00 100 $90 25% $279 $20 2021 $30.00 100 $84 25% $180 $20 Projection 2022E $49.00 100 $100 25% $290 $20 2020 $3.69 $0.90 $27.30 2021 $2.64 $0.84 $29.10 Projection 2022E $3.90 $1.00 $32.00 2020 2021 2022E Industry Average 7.2% 6.7% Ratios 4.4% Read C D E F G H 2020 2021 2022E A B 71 72 Ratio Analysis 73 74 Profit margin 75 Operating profit margin 76 Basic earning power 77 ROA 78 ROE 79 Inventory turnover 80 Days sales outstanding 81 Fixed assets turnover 82 Total assets turnover 83 Current 84 Quick 85 Debt ratio 86 Debt-to-equity ratio 87 Liabilities-to-assets ratio 88 Equity multiplier 89 TIE 90 EBITDA coverage 91 Price/earnings (P/E) 92 Market/book 93 94 95 6.7% 10.2% 13.7% 9.0% 13.5% 7.4 26.5 1.9 1.348 2.1 1.0 20.8% 0.31 33.1% 1.5 8.2 9.9 13.6 1.8 4.4% 7.7% 9.4% 5.4% 9.1% 6.2 31.6 1.7 1.224 1.6 0.7 27.6% 0.46 40.6% 1.7 4.3 6.3 11.4 Industry Average 7.2% 10.4% 15.6% 10.8% 15.4% 9.0 28.0 3.0 1.5 2.5 1.4 15.0% 0.22 30.0% 1.5 13.0 17.2 16.8 2.6 1.0


