

Answered step by step
Verified Expert Solution
Question
1 Approved Answer
please provide the graph and answer to all the questions. 26. Two stocks, one high risk (Happy) and one low risk (Lonely), have been evaluated
please provide the graph and answer to all the questions. 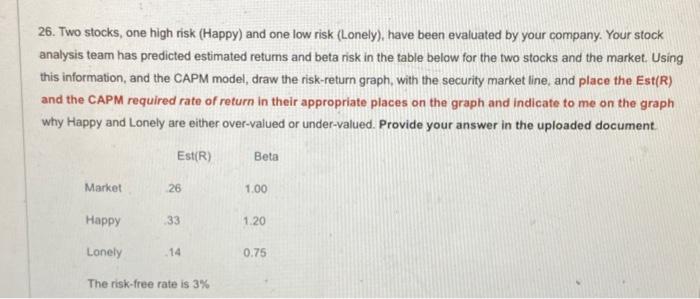
26. Two stocks, one high risk (Happy) and one low risk (Lonely), have been evaluated by your company. Your stock analysis team has predicted estimated retums and beta risk in the table below for the two stocks and the market. Using this information, and the CAPM model, draw the risk-return graph, with the security market line, and place the Est(R) and the CAPM required rate of return in their appropriate places on the graph and indicate to me on the graph why Happy and Lonely are either over-valued or under-valued. Provide your answer in the uploaded document. The risk-free rate is 3% Step by Step Solution
There are 3 Steps involved in it
Step: 1

Get Instant Access to Expert-Tailored Solutions
See step-by-step solutions with expert insights and AI powered tools for academic success
Step: 2

Step: 3
Ace Your Homework with AI
Get the answers you need in no time with our AI-driven, step-by-step assistance
Get Started
Applied Equity Analysis and Portfolio Management Tools to Analyze and Manage Your Stock Portfolio
Authors: Robert A.Weigand
1st edition
978-111863091, 1118630912, 978-1118630914