Please provide the solutions on EXCEL
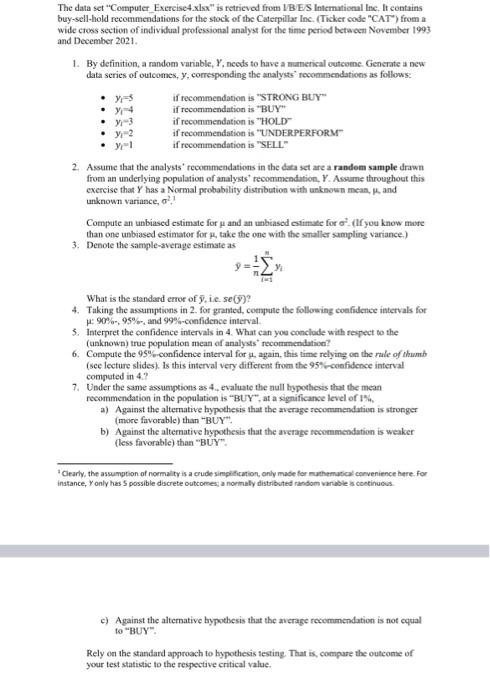
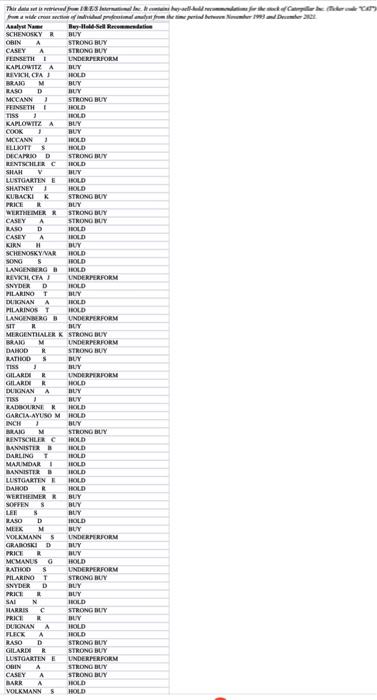
The data set "Computer_Exercise4.xlsx" is retrievod from IB ESS Intemational lne, It contains buy-sell-hold recotnmendations for the stock of the Caterpillar Inc. (Ticker code "CAT") from a wide croos section of individual professional analyst for the time period between November 1993 and December 2021. 1. By definition, a random variable, Y, needs to have a numerical outcome. Gencrate a new data series of outcomes, y, corresponding the analysts' rocommendations as follows: - y4=5 - y4=4 - yi=3 - y2=2 - y1=1 if recommendation is "STRONG BUY" if recommendation is "BUY" if recommendation is "HOLD" if recommendation is "UNDERPERFORM" if recommendation is "SFLL" 2. Assume that the analysts' recommendations in the dasa set are a randem sample drawn from an underlying population of analysts' recommendation, Y. Assume throughout this exercise that Y has a Normal probability distribution with unknown mean, , and unknown variance, 21 ? Compute an unbiased estimate for and an unbiasod otimate for 2. (If you know more than one unbiased estimator for , take the one with the smaller sampling variance,) 3. Denote the sample-sverage estimate as y=n1i=1nyi What is the standard enror of y, ic. se(y) ? 4. Taking the assumptions in 2 . for granted, cormpule the following confidence intervals for :90%95%, and 99%-confidence interval. 5. Interpret the confidence intervals in 4 . What can you conclude with respect to the (unknown) true population mean of analysts' recommendation? 6. Compute the 95%-confidence interval for 11 again, this time relying on the rule of thumb (see lecture slides). Is this interval very different from the 95%-ceafidence interval computed in 4 ? 7. Under the same assumptions as 4., evaluate the null hypothesis that the mean recommendation in the population is "BUY", at a significance level of 1%, a) Against the altemative hypothesis that the average recommendation is stronger (more favorable) than "BUY". b) Against the alternative hypothesis that the average tecommendation is weaker (less favorable) than "BUY". "Clearly, the assumption of normalty is a crude simpification, only made for nuthemuscal convenience here. for instance, y only has 5 possible discrete outcomes; a normaly distributed random varnoble is coetinuous. c) Against the alternative bypothesis that the ancrage recommendation is not equal to "BUY". Rely on the standard approach to hypothesis testine. That is, compare the outconse of your test statistic to the respective critical value. The data set "Computer_Exercise4.xlsx" is retrievod from IB ESS Intemational lne, It contains buy-sell-hold recotnmendations for the stock of the Caterpillar Inc. (Ticker code "CAT") from a wide croos section of individual professional analyst for the time period between November 1993 and December 2021. 1. By definition, a random variable, Y, needs to have a numerical outcome. Gencrate a new data series of outcomes, y, corresponding the analysts' rocommendations as follows: - y4=5 - y4=4 - yi=3 - y2=2 - y1=1 if recommendation is "STRONG BUY" if recommendation is "BUY" if recommendation is "HOLD" if recommendation is "UNDERPERFORM" if recommendation is "SFLL" 2. Assume that the analysts' recommendations in the dasa set are a randem sample drawn from an underlying population of analysts' recommendation, Y. Assume throughout this exercise that Y has a Normal probability distribution with unknown mean, , and unknown variance, 21 ? Compute an unbiased estimate for and an unbiasod otimate for 2. (If you know more than one unbiased estimator for , take the one with the smaller sampling variance,) 3. Denote the sample-sverage estimate as y=n1i=1nyi What is the standard enror of y, ic. se(y) ? 4. Taking the assumptions in 2 . for granted, cormpule the following confidence intervals for :90%95%, and 99%-confidence interval. 5. Interpret the confidence intervals in 4 . What can you conclude with respect to the (unknown) true population mean of analysts' recommendation? 6. Compute the 95%-confidence interval for 11 again, this time relying on the rule of thumb (see lecture slides). Is this interval very different from the 95%-ceafidence interval computed in 4 ? 7. Under the same assumptions as 4., evaluate the null hypothesis that the mean recommendation in the population is "BUY", at a significance level of 1%, a) Against the altemative hypothesis that the average recommendation is stronger (more favorable) than "BUY". b) Against the alternative hypothesis that the average tecommendation is weaker (less favorable) than "BUY". "Clearly, the assumption of normalty is a crude simpification, only made for nuthemuscal convenience here. for instance, y only has 5 possible discrete outcomes; a normaly distributed random varnoble is coetinuous. c) Against the alternative bypothesis that the ancrage recommendation is not equal to "BUY". Rely on the standard approach to hypothesis testine. That is, compare the outconse of your test statistic to the respective critical value