

Question
Please provide working code for R Programming to visualize following, already solved on chegg is not working please provide working one: This project is about
Please provide working code for R Programming to visualize following, already solved on chegg is not working please provide working one:
This project is about the harmonized index of consumer prices in the EU. It involves three simple steps. First, you must get the data, then its simple visualization, and finally, its clustering.
Data
The data come from Eurostat. The easiest way to get the data is to use the eurostat package. We deal with the monthly HICP year-on-year data for the whole basket (CP00) for all EU countries from Feb 2000 through Sep 2022. The datasets code is prc_hicp_manr. In the dataset, there are only countries codes, e.g., `PL` for Poland or DE for Germany. You have to add proper country names.
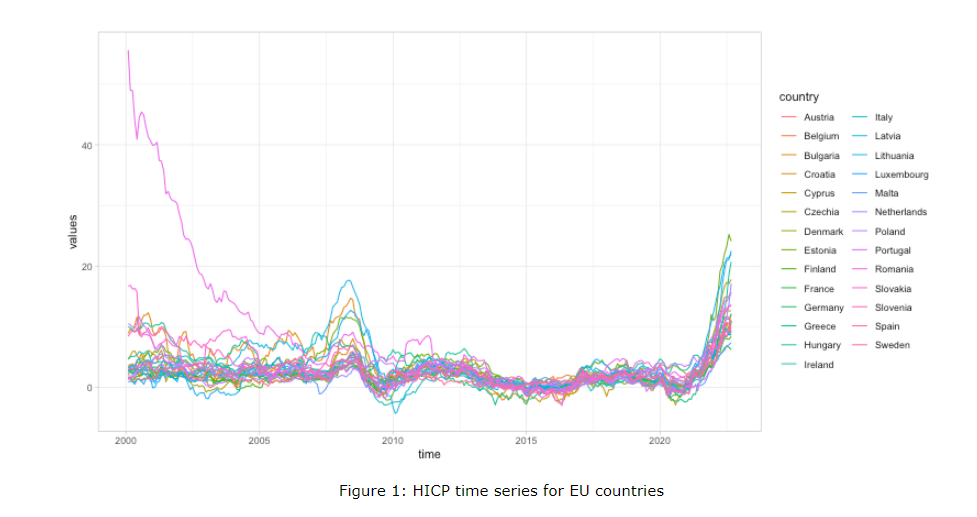
Simple visualization
Once the data frame is ready (previous step), we need to create a simple visualization. The following figure shows a simple example. I used the ggplot2 package, but it is up to you how to make the figure. You do not have to match my figure exactly. Yet, you have to retain the same features.
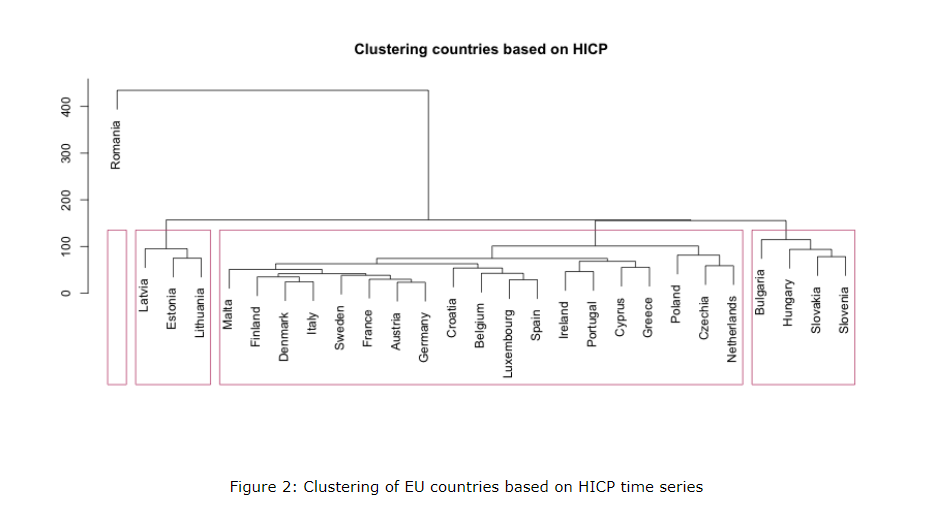
Clustering
An HICP time series represent each country. All time series are of equal length. We can treat these time series as vectors of equal dimension. We want to see how similar countries are in terms of HICP. Thus, we use the clustering analysis. In particular, you have to use agglomerative hierarchical clustering with complete linkage. Differences between the vectors (times series) should be computed with the Minkowski metrics for p=1.5=1.5. Finally, based on the resulting tree, create 44 clusters. Once this is done, create a simple visualization. The following figure shows an example of the visualization.
Step by Step Solution
There are 3 Steps involved in it
Step: 1

Get Instant Access to Expert-Tailored Solutions
See step-by-step solutions with expert insights and AI powered tools for academic success
Step: 2

Step: 3
Ace Your Homework with AI
Get the answers you need in no time with our AI-driven, step-by-step assistance
Get Started
Entity Alignment Concepts Recent Advances And Novel Approaches
Authors: Xiang Zhao ,Weixin Zeng ,Jiuyang Tang
1st Edition
9819942527, 978-9819942527