PLEASE PUT EXCEL FORMULAS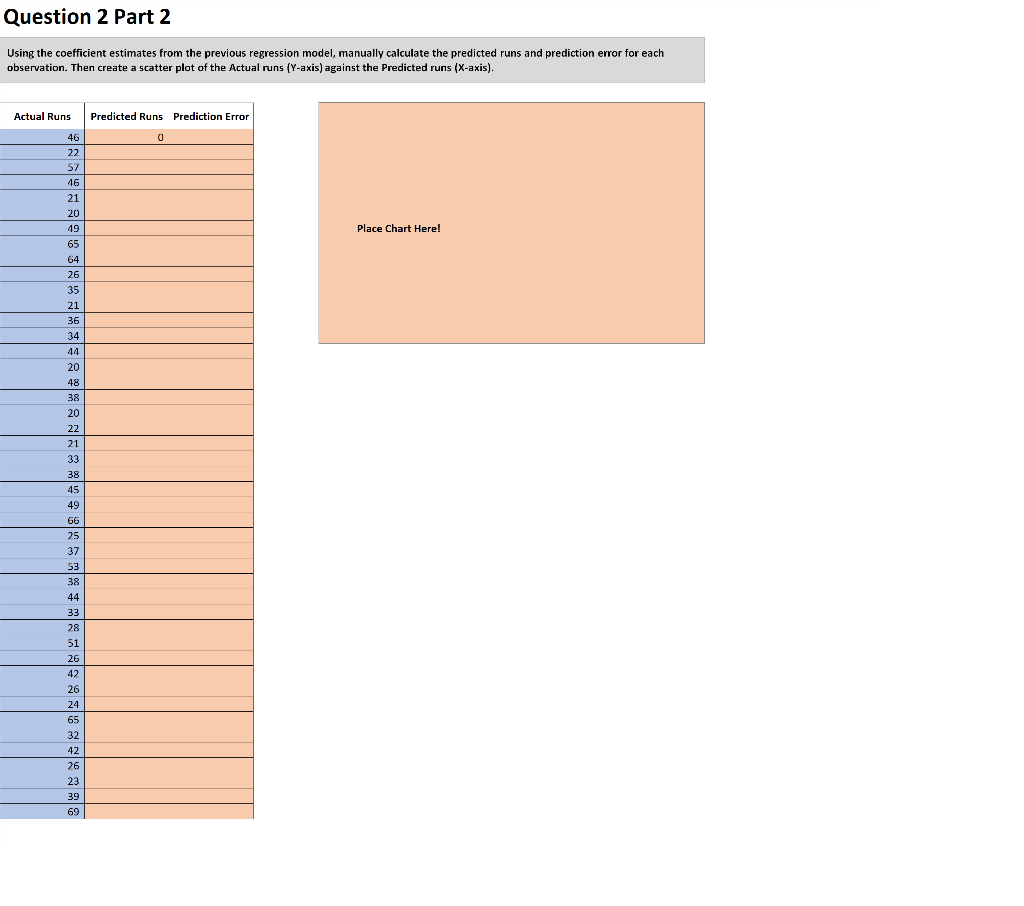
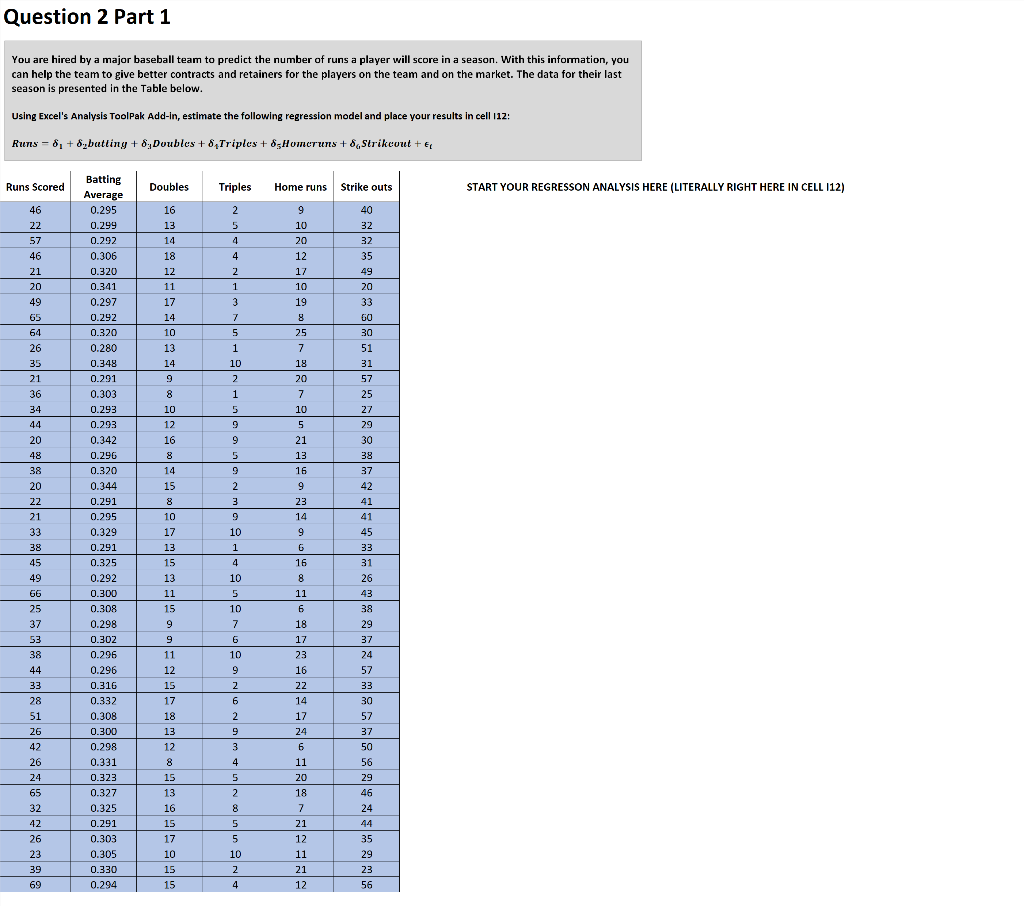
Question 2 Part 1 You are hired by a major baseball team to predict the number of runs a player will score in a season. With this information, you can help the team to give better contracts and retainers for the players on the team and on the market. The data for their last season is presented in the Table below. Using Excel's Analysis ToolPak Add-in, estimate the following regression model and place your results in cell 112: Runs = 8, + 8ybutliny + 8yDoubles + & Triples + 8sHomeruns+&Strikcout + E1 Runs Scored Doubles Triples Home runs Strike outs START YOUR REGRESSON ANALYSIS HERE (LITERALLY RIGHT HERE IN CELL 112) 46 22 57 46 21 20 49 2 5 4 4 Batting Average 0.295 0.299 0.292 0.306 0.320 0.341 0.297 0.292 0.320 0.280 16 13 14 18 12 9 10 20 12 17 4 2 2 1 40 32 32 35 49 20 33 11 17 14 10 19 3 7 8 25 65 .. 64 26 35 10 13 14 9 7 .. 18 5 . 1 10 2 1 1 5. 5 9 9 9 5 8 10 10 12 16 60 30 51 31 57 25 25 27 27 29 30 38 21 20 36 34 44 20 48 38 20 20 22 21 33 38 45 20 . 7 10 10 5 5 21 13 16 14 15 15 9 10 17 13 2 2 3 9 10 1 4 37 42 41 41 45 33 31 26 15 13 23 14 9 6 16 8 11 6 18 11 49 66 25 37 10 5 10 0.348 0.291 0302 0.303 0.293 0.293 0.342 0.296 0.320 0.344 0.291 0.295 0.329 0.291 0.325 0.292 0.300 0.308 0.298 0.302 0.296 0.296 0.316 0.332 0.308 0.300 0.298 0.331 22:24 0.323 0.327 0.325 0.291 0.303 0.305 0.330 0.294 43 38 15 9 9 9 11 12 15 17 23 53 20 38 44 33 28 51 26 42 26 16 22 14 29 37 24 57 33 30 57 37 50 7 6 10 9 2 6 6 2 9 3 4 5 2 17 18 18 13 12 17 24 6 11 20 18 56 29 46 24 15 13 16 15 17 5 24 65 32 . 42 2 26 23 39 69 44 5 10 10 7 21 12 11 21 12 10 15 15 35 29 23 56 2 4 Question 2 Part 2 Using the coefficient estimates from the previous regression model, manually calculate the predicted runs and prediction error for each observation. Then create a scatter plot of the Actual runs (Y-axis) against the Predicted runs (X-axis). Actual Runs Predicted Runs Prediction Error 0 Place Chart Here! 46 22 57 46 21 20 49 65 64 26 35 21 36 34 44 20 48 38 20 22 21 33 38 45 49 66 25 37 53 20 38 44 33 28 51 26 42 26 24 65 32 42 26 23 39 69 Question 2 Part 1 You are hired by a major baseball team to predict the number of runs a player will score in a season. With this information, you can help the team to give better contracts and retainers for the players on the team and on the market. The data for their last season is presented in the Table below. Using Excel's Analysis ToolPak Add-in, estimate the following regression model and place your results in cell 112: Runs = 8, + 8ybutliny + 8yDoubles + & Triples + 8sHomeruns+&Strikcout + E1 Runs Scored Doubles Triples Home runs Strike outs START YOUR REGRESSON ANALYSIS HERE (LITERALLY RIGHT HERE IN CELL 112) 46 22 57 46 21 20 49 2 5 4 4 Batting Average 0.295 0.299 0.292 0.306 0.320 0.341 0.297 0.292 0.320 0.280 16 13 14 18 12 9 10 20 12 17 4 2 2 1 40 32 32 35 49 20 33 11 17 14 10 19 3 7 8 25 65 .. 64 26 35 10 13 14 9 7 .. 18 5 . 1 10 2 1 1 5. 5 9 9 9 5 8 10 10 12 16 60 30 51 31 57 25 25 27 27 29 30 38 21 20 36 34 44 20 48 38 20 20 22 21 33 38 45 20 . 7 10 10 5 5 21 13 16 14 15 15 9 10 17 13 2 2 3 9 10 1 4 37 42 41 41 45 33 31 26 15 13 23 14 9 6 16 8 11 6 18 11 49 66 25 37 10 5 10 0.348 0.291 0302 0.303 0.293 0.293 0.342 0.296 0.320 0.344 0.291 0.295 0.329 0.291 0.325 0.292 0.300 0.308 0.298 0.302 0.296 0.296 0.316 0.332 0.308 0.300 0.298 0.331 22:24 0.323 0.327 0.325 0.291 0.303 0.305 0.330 0.294 43 38 15 9 9 9 11 12 15 17 23 53 20 38 44 33 28 51 26 42 26 16 22 14 29 37 24 57 33 30 57 37 50 7 6 10 9 2 6 6 2 9 3 4 5 2 17 18 18 13 12 17 24 6 11 20 18 56 29 46 24 15 13 16 15 17 5 24 65 32 . 42 2 26 23 39 69 44 5 10 10 7 21 12 11 21 12 10 15 15 35 29 23 56 2 4 Question 2 Part 2 Using the coefficient estimates from the previous regression model, manually calculate the predicted runs and prediction error for each observation. Then create a scatter plot of the Actual runs (Y-axis) against the Predicted runs (X-axis). Actual Runs Predicted Runs Prediction Error 0 Place Chart Here! 46 22 57 46 21 20 49 65 64 26 35 21 36 34 44 20 48 38 20 22 21 33 38 45 49 66 25 37 53 20 38 44 33 28 51 26 42 26 24 65 32 42 26 23 39 69