

Question
Please put this in a Matlab format Here are the time and voltage values: Time :0 - 50 seconds in .5 increments Voltage (below): 1131.295423
Please put this in a Matlab format
Here are the time and voltage values:
Time :0 - 50 seconds in .5 increments
Voltage (below):
1131.295423 1070.828614 1013.593705 959.4179554 908.137855 859.5986337 813.6537939 770.1646679 729 690.0355497 653.1537172 618.2431883 585.1985985 553.9202148 524.313635 496.2895026 469.7632369 444.6547784 420.8883462 398.3922104 377.0984745 356.9428712 337.8645684 319.8059851 302.7126183 286.5328779 271.2179313 256.721556 243 230.0118499 217.7179057 206.0810628 195.0661995 184.6400716 174.7712117 165.4298342 156.5877456 148.2182595 140.2961154 132.7974035 125.6994915 118.9809571 112.6215228 106.601995 100.9042061 95.5109593 90.4059771 85.57385199 81 76.67061663 72.57263525 68.69368759 65.0220665 61.54669054 58.25707056 55.14327806 52.19591521 49.40608648 46.7653718 44.26580115 41.8998305 39.66031902 37.5405076 35.53399835 33.63473537 31.83698643 30.1353257 28.52461733 27 25.55687221 24.19087842 22.89789586 21.67402217 20.51556351 19.41902352 18.38109269 17.3986384 16.46869549 15.58845727 14.75526705 13.96661017 13.22010634 12.51350253 11.84466612 11.21157846 10.61232881 10.04510857 9.508205777 9
Thank you for your time.
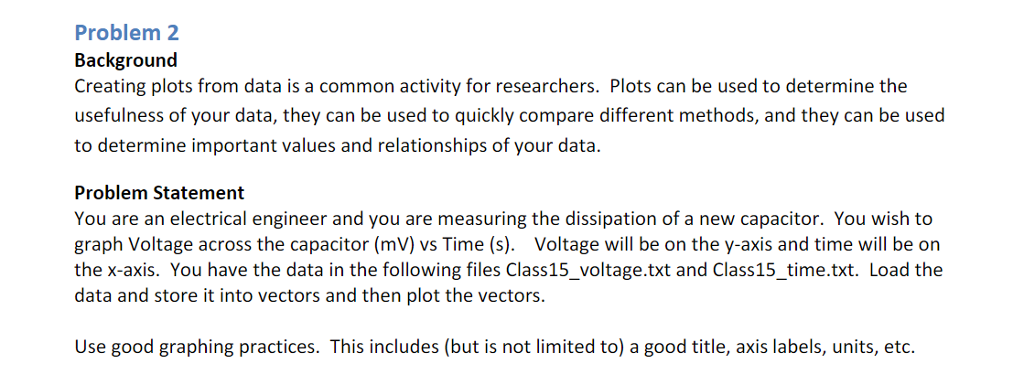
Problem 2 Background Creating plots from data is a common activity for researchers. Plots can be used to determine the usefulness of your data, they can be used to quickly compare different methods, and they can be used to determine important values and relationships of your data Problem Statement You are an electrical engineer and you are measuring the dissipation of a new capacitor. You wish to graph Voltage across the capacitor (mV) vs Time (s). Voltage will be on the y-axis and time will be on the x-axis. You have the data in the following files Class15_voltage.txt and Class15_time.txt. Load the data and store it into vectors and then plot the vectors. Use good graphing practices. This includes (but is not limited to) a good title, axis labels, units, eto
Step by Step Solution
There are 3 Steps involved in it
Step: 1

Get Instant Access to Expert-Tailored Solutions
See step-by-step solutions with expert insights and AI powered tools for academic success
Step: 2

Step: 3
Ace Your Homework with AI
Get the answers you need in no time with our AI-driven, step-by-step assistance
Get Started
Pro SQL Server Wait Statistics
Authors: Enrico Van De Laar
1st Edition
1484211391, 9781484211397