Answered step by step
Verified Expert Solution
Question
1 Approved Answer
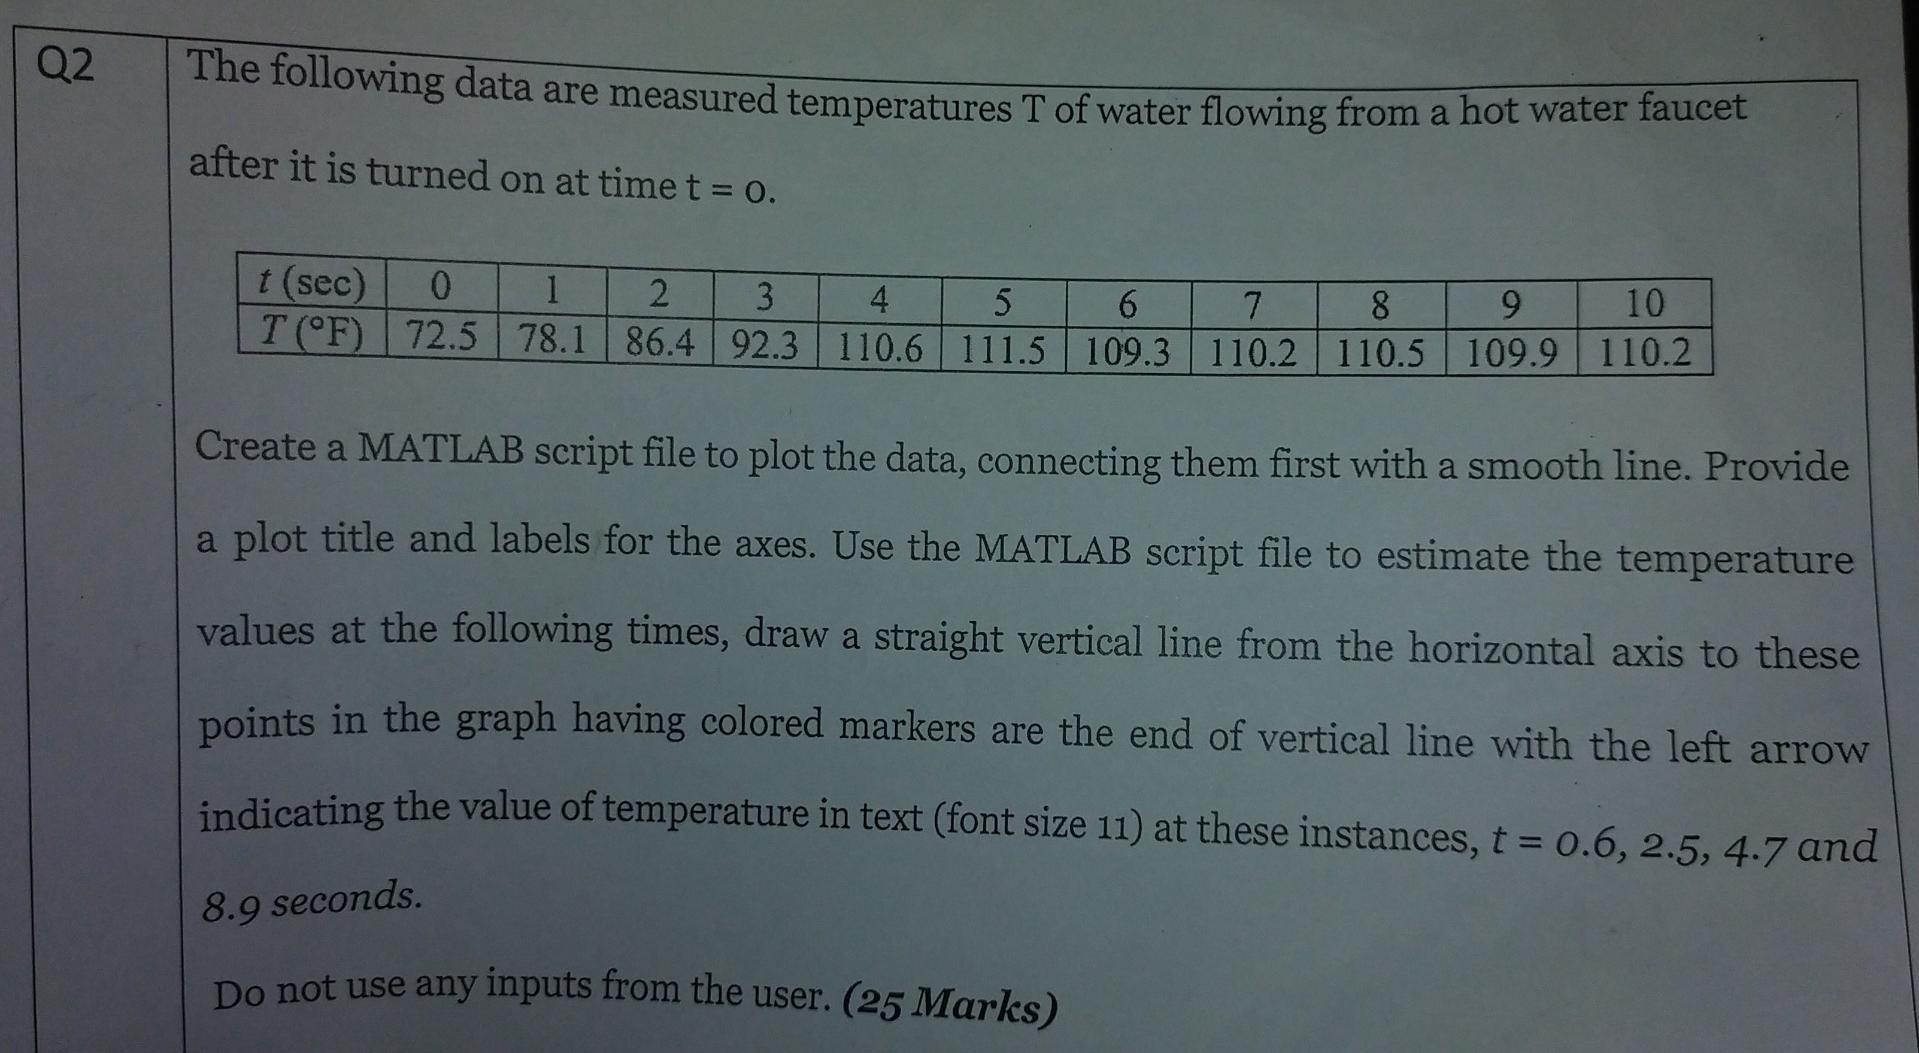
please Q2 The following data are measured temperatures T of water flowing from a hot water faucet after it is turned on at time t

please
Q2 The following data are measured temperatures T of water flowing from a hot water faucet after it is turned on at time t = 0. t (sec) 0 1 2 3 4 5 6 7 T(F) 72.5 78.1 86.4 92.3 110.6 111.5 109.3 110.2 8 9 10 110.5 109.9 110.2 Create a MATLAB script file to plot the data, connecting them first with a smooth line. Provide a a plot title and labels for the axes. Use the MATLAB script file to estimate the temperature values at the following times, draw a straight vertical line from the horizontal axis to these points in the graph having colored markers are the end of vertical line with the left arrow indicating the value of temperature in text (font size 11) at these instances, t = 0.6, 2.5, 4.7 and 8.9 seconds. Do not use any inputs from the user. (25 Marks)Step by Step Solution
There are 3 Steps involved in it
Step: 1

Get Instant Access to Expert-Tailored Solutions
See step-by-step solutions with expert insights and AI powered tools for academic success
Step: 2

Step: 3

Ace Your Homework with AI
Get the answers you need in no time with our AI-driven, step-by-step assistance
Get Started


