please question 6-8 if you can or question 10 to untill the end
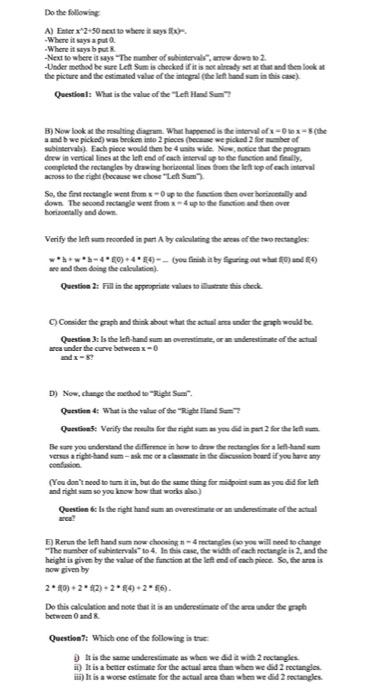
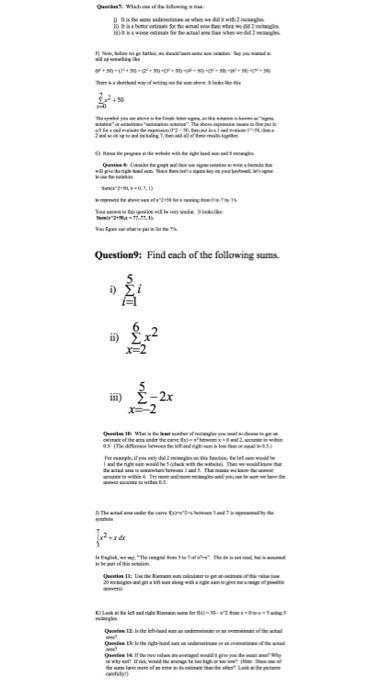
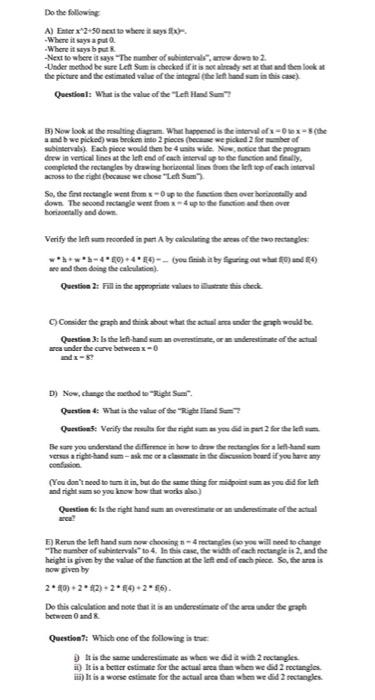
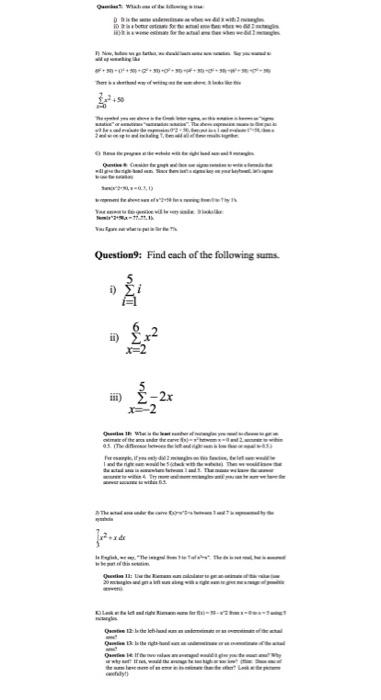
Do the following A) Enter x 2-50 next to where it says x). Where it says a put a -Where it says b put -Next to where it says "The number of subintervals", arrow down to 2. -Under method be sure Left Sum is checked if it is not already set at that and then look at the picture and the estimated value of the integral (the left hand in this case) Question: What is the value of the "Left Hand Sum"? B) Now look at the resulting diagram. What happened is the interval of x-0 tox-8 (the a and b we picked) was broken into 2 pieces (because we picked 2 for number of subintervals). Each piece would then be 4 units wide. New, notice that the program drew in vertical lines at the left end of each interval up to the function and finally, completed the rectangles by drawing horizontal lines from the left top of each interval across to the right (because we chose "Left Sum"). So, the first rectangle went from x-0 up to the function then over horizontally and down. The second rectangle went from x-4 up to the function and then over horizontally and down Verify the left sum recorded in part A by calculating the areas of the two rectangles 3-40)+44)-(you finish it by figuring out what ) and (4) are and then doing the calculation) C) Consider the graph and think about what the actual area under the graph would be Question 3: Is the left-hand sum an overestimate, or an underestimate of the actual area under the curve between x-0 D) Now, change the method to "Right Sum". Question 4: What is the value of the "Right Hand Sum Questions: Verify the results for the right sum as you did in part 2 for the left Be sure you understand the difference in how to draw the rectangles for a left-hand sum versus a right-hand sum-ask me or a classmate in the discussion board if you have any confusion (You don't need to turn it in, but do the same thing for midpoint sumas you did for left and right sum so you know how that works also) Question is the right hand sum an overestimate or an underestimate of the actual area? E) Rerun the left hand sum now choosing a-4 rectangles (so you will need to change "The number of subintervals to 4. In this case, the width of each rectangle is 2, and the height is given by the value of the function at the left end of each piece. So, the area is now given by Do this calculation and note that it is an underestimate of the area under the graph between 0 and 8. Question 7: Which one of the following is true It is the same underestimate as when we did it with 2 rectangles i) It is a better estimate for the actual area than when we did 2 rectangles iii) It is a worse estimate for the actual area than when we did 2 rectangles. 2*80)+2*2)+284)+2* 56). Qumhuut Wah 1 ivefor ts Basuter prty auntk nti 2 rmewdk - Question9: Find each of the following sums. ? en real at +303033 ii) -2x Q1 W 45 The diffe frsaigsitymi Testistrie | wxnd the rigted he 5te outatec wi ATH "The la Question 1: the 20 gang wa chslen Qsstone 12: Is de lot la Quumdian 13: Is the gha- and antias he if twe why would the g theme of neagles Do the following A) Enter x2+50 next to where it says -Where it says a put -Where it says put -Next to where it says "The number of subintervals", arrow down to 2. -Under method be sure Left Sum is checked if it is not already set at that and then look at the picture and the estimated value of the integral (the left hand Question1: What is the value of the "Left Hand Sum"? B) Now look at the resulting diagram. What happened is the interval of x-0 tox-5 (the a and b we picked) was broken into 2 pieces (because we picked 2 for number of subintervals). Each piece would then be 4 units wide. New, notice that the program drew in vertical lines at the left end of each interval up to the function and finally, completed the rectangles by drawing horizontal lines from the left top of each interval across to the right (because we chose "Left Sum"). So, the first rectangle went from x-0 up to the function then over horizontally and down. The second rectangle went from x4 up to the function and then over horizontally and down Verify the left sum recorded in part A by calculating the areas of the two rectangles 3-40-44)-(you finish it by figuring out what ) and (4) are and then doing the calculation). C) Consider the graph and think about what the actual arra under the graph would be Question 3: Is the left-hand sum an overestimate, or an underestimate of the actual area under the curve between x-0 and x-8? D) Now, change the method to "Right Sum Question 4: What is the value of the Right Hand Sum Question: Verify the results for the right sum as you did in part 2 for the left Be sure you understand the difference in how to draw the rectangles for left-hand s versus a right-hand sum-ask me or a classmate in the discussion board if you have any confusion. (You don't need to turn it in, but do the same thing for midpoint sum as you did for left and right sum so you know how that works also) Question is the right hand sum an overestimate or an underestimate of the actual area? E) Rerun the left hand sum now choosing a-4 rectangles (so you will need to change "The number of subintervals" to 4. In this case, the width of each rectangle is 2, and the height is given by the value of the function at the left end of each piece. So, the area is now given by 280) 2 (2) 2 (4)+2*86). Do this calculation and note that it is an underestimate of the area under the graph between 0 and 8. Question 7: Which one of the following is true It is the same underestimate as when we did it with 2 rectangles i) It is a better estimate for the actual area than when we did 2 rectangles iii) It is a worse estimate for the actual area than when we did 2 rectangles Qunharh;Wah is iovie Sor te Soreal hoti ntin we 20 a Question9: Find each of the following sums. ? this sete men semas +30303 C THNH NHN Chun thun t l e x-2x Q1 Wh 05. The deste ano fsigsitymi Testosteem | nd trig taeulatecnn 4 RA CHNG A MINH B ltta i nargles "The ill gang Question 11: the 20 Qacmtue 12: Is de kob la Quntion 13: bote g nian 14 fe why would the high soooften Do the following A) Enter x 2-50 next to where it says x). Where it says a put a -Where it says b put -Next to where it says "The number of subintervals", arrow down to 2. -Under method be sure Left Sum is checked if it is not already set at that and then look at the picture and the estimated value of the integral (the left hand in this case) Question: What is the value of the "Left Hand Sum"? B) Now look at the resulting diagram. What happened is the interval of x-0 tox-8 (the a and b we picked) was broken into 2 pieces (because we picked 2 for number of subintervals). Each piece would then be 4 units wide. New, notice that the program drew in vertical lines at the left end of each interval up to the function and finally, completed the rectangles by drawing horizontal lines from the left top of each interval across to the right (because we chose "Left Sum"). So, the first rectangle went from x-0 up to the function then over horizontally and down. The second rectangle went from x-4 up to the function and then over horizontally and down Verify the left sum recorded in part A by calculating the areas of the two rectangles 3-40)+44)-(you finish it by figuring out what ) and (4) are and then doing the calculation) C) Consider the graph and think about what the actual area under the graph would be Question 3: Is the left-hand sum an overestimate, or an underestimate of the actual area under the curve between x-0 D) Now, change the method to "Right Sum". Question 4: What is the value of the "Right Hand Sum Questions: Verify the results for the right sum as you did in part 2 for the left Be sure you understand the difference in how to draw the rectangles for a left-hand sum versus a right-hand sum-ask me or a classmate in the discussion board if you have any confusion (You don't need to turn it in, but do the same thing for midpoint sumas you did for left and right sum so you know how that works also) Question is the right hand sum an overestimate or an underestimate of the actual area? E) Rerun the left hand sum now choosing a-4 rectangles (so you will need to change "The number of subintervals to 4. In this case, the width of each rectangle is 2, and the height is given by the value of the function at the left end of each piece. So, the area is now given by Do this calculation and note that it is an underestimate of the area under the graph between 0 and 8. Question 7: Which one of the following is true It is the same underestimate as when we did it with 2 rectangles i) It is a better estimate for the actual area than when we did 2 rectangles iii) It is a worse estimate for the actual area than when we did 2 rectangles. 2*80)+2*2)+284)+2* 56). Qumhuut Wah 1 ivefor ts Basuter prty auntk nti 2 rmewdk - Question9: Find each of the following sums. ? en real at +303033 ii) -2x Q1 W 45 The diffe frsaigsitymi Testistrie | wxnd the rigted he 5te outatec wi ATH "The la Question 1: the 20 gang wa chslen Qsstone 12: Is de lot la Quumdian 13: Is the gha- and antias he if twe why would the g theme of neagles Do the following A) Enter x2+50 next to where it says -Where it says a put -Where it says put -Next to where it says "The number of subintervals", arrow down to 2. -Under method be sure Left Sum is checked if it is not already set at that and then look at the picture and the estimated value of the integral (the left hand Question1: What is the value of the "Left Hand Sum"? B) Now look at the resulting diagram. What happened is the interval of x-0 tox-5 (the a and b we picked) was broken into 2 pieces (because we picked 2 for number of subintervals). Each piece would then be 4 units wide. New, notice that the program drew in vertical lines at the left end of each interval up to the function and finally, completed the rectangles by drawing horizontal lines from the left top of each interval across to the right (because we chose "Left Sum"). So, the first rectangle went from x-0 up to the function then over horizontally and down. The second rectangle went from x4 up to the function and then over horizontally and down Verify the left sum recorded in part A by calculating the areas of the two rectangles 3-40-44)-(you finish it by figuring out what ) and (4) are and then doing the calculation). C) Consider the graph and think about what the actual arra under the graph would be Question 3: Is the left-hand sum an overestimate, or an underestimate of the actual area under the curve between x-0 and x-8? D) Now, change the method to "Right Sum Question 4: What is the value of the Right Hand Sum Question: Verify the results for the right sum as you did in part 2 for the left Be sure you understand the difference in how to draw the rectangles for left-hand s versus a right-hand sum-ask me or a classmate in the discussion board if you have any confusion. (You don't need to turn it in, but do the same thing for midpoint sum as you did for left and right sum so you know how that works also) Question is the right hand sum an overestimate or an underestimate of the actual area? E) Rerun the left hand sum now choosing a-4 rectangles (so you will need to change "The number of subintervals" to 4. In this case, the width of each rectangle is 2, and the height is given by the value of the function at the left end of each piece. So, the area is now given by 280) 2 (2) 2 (4)+2*86). Do this calculation and note that it is an underestimate of the area under the graph between 0 and 8. Question 7: Which one of the following is true It is the same underestimate as when we did it with 2 rectangles i) It is a better estimate for the actual area than when we did 2 rectangles iii) It is a worse estimate for the actual area than when we did 2 rectangles Qunharh;Wah is iovie Sor te Soreal hoti ntin we 20 a Question9: Find each of the following sums. ? this sete men semas +30303 C THNH NHN Chun thun t l e x-2x Q1 Wh 05. The deste ano fsigsitymi Testosteem | nd trig taeulatecnn 4 RA CHNG A MINH B ltta i nargles "The ill gang Question 11: the 20 Qacmtue 12: Is de kob la Quntion 13: bote g nian 14 fe why would the high soooften


