

Question
please re right this physics lab in your o w n words with modifications as well. Introduction: Rotational dynamics, derived from Newton's Second Law, is
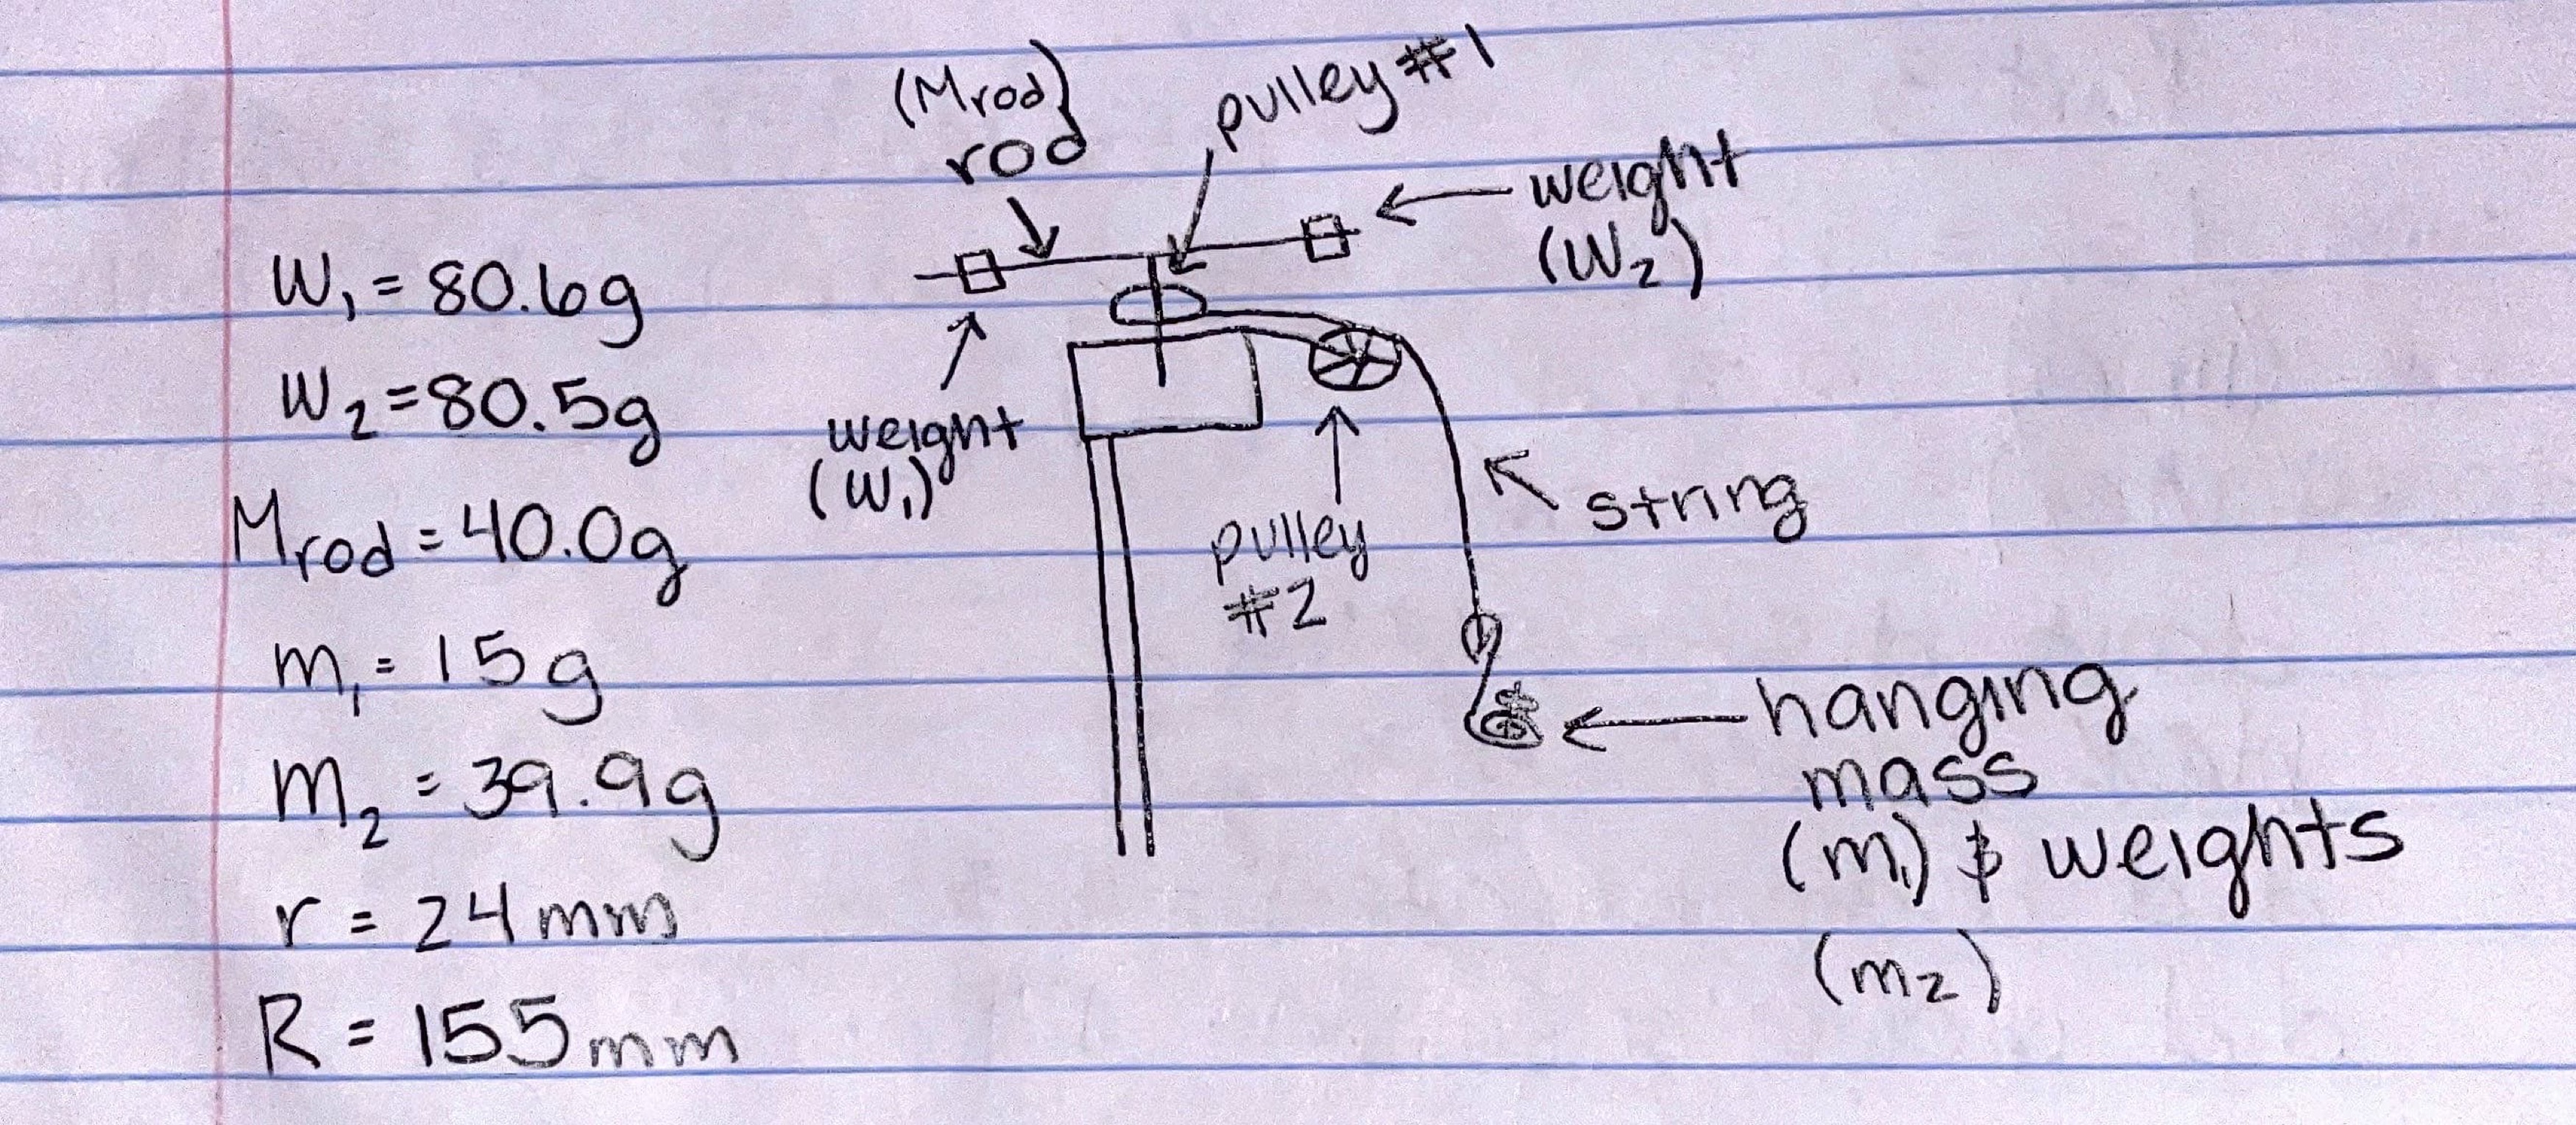
please re right this physics lab in your o w n words with modifications as well. Introduction: Rotational dynamics, derived from Newton's Second Law, is useful in physics as it is analogous to linear dynamics. Like force being directly related to velocity, torque governs the rotational velocity that is calculated by the moment of inertia times the angular acceleration. This results in the moment of inertia being the "mass" of rotational dynamics of which its properties, specifically its dependence on weight distribution, can be studied using the setup of a three-step pulley, a hanging mass, and adjusting the weight on the larger pulley. The three-step pulley with a hanging mass gives the necessary information to calculate the moment of inertia (1) by observing the changes in angular acceleration when the weight distribution (or radius) of the larger pulley changes. The moment of inertia can then be calculated using the following equation: I = T/ a = mr(g-r a)/ a The experimental moments of inertia calculated from the Equation 1 can then be plotted on a graph to determine the relationship between the moment of inertia and weight distribution and answer the question of how the distribution of mass affects the moment of inertia. Procedure: There are two major steps to this experiment apart from the analysis post-experiment. The first step is the process of setting up the experiment. Begin by setting up the three-step pulley, and tying a string, about a meter long, onto the larger pulley on the Rotary Motion Sensor. Prepare the rod and weights by finding the mass of each weight and the rod individually, Next, attach the weights on opposite sides, equidistant from the center and measure that distance. Prepare the hanging mass by adding a mass between 10-30g to the hanger that is about 15g - the total mass should be about 25-45 g - and tie the hanging mass to the other end of the string, ultimately attaching the hanging mass to the three-step pulley (see figure 1 above). Lastly, prepare the data collection program, LoggerPro, for data collection. The second step is the process of running the experiment and collecting data. Wind up the string onto the largest pulley on the motional sensor, start data collection, and release the weight. Determine the angular acceleration by finding the slope of the angular velocity vs. time graph. Run this experiment five more times, each time adjusting the distance between the weights and the center of rotation. Lastly, calculate the moments of inertia for each run using eq. 1 and compile the data on a graph for further analysis. Results: Data was collected from six trials, at different radius lengths (r), all between the center of rotation (center of the rod) and the end of the rod. Each trial is comprised of a single run and the data obtained from each run was used. This includes the angular accelerations and uncertainties resulting from the slope of the angular velocity vs. time graphs (see figure 3 in the appendix). For each trial, the effects of friction and air resistance are assumed to be negligible. Figure 4 demonstrates a calculation for the moment of inertia, all moments of inertia were calculated using equation 1. Figure 5 shows the experimental data obtained from the runs including the radius of the weights (r) and the angular accelerations. All calculations for the moments of inertia are shown in figure 6, along with the "constants" or the values for the additional variables including the mass (m), radius (r), and the acceleration due to gravity (g)) necessary for the calculation. Figure 2 is the resulting moment of inertia (I) vs. radius squared (r?) graph. The radius was ultimately squared to linearize the graph which was used for further analysis of the relationship of inertia and the weight distribution on the rod. Discussion: The slope of the graph obtained from the calculated moments of inertia and its respective radii demonstrate a linear relationship when the radii are squared. This graph also shows the experimental value of the slope obtained to be 0.1661 kg*m m? +/-0.012 kg*m?mwhich also resulted in a non-negligible y-intercept of 0.00071 +/- 0.0002 kg*m?. From this, it can be seen that when the radius, or distance between the weight and the center of rotation, is small - for example 3.75 cm, the angular acceleration is faster than that of a larger radius. This results in a much smaller moment of inertia, as shown by the resulting graph (Figure 2) - when the radius is on the smaller side, there is a smaller moment of inertia. The moment of inertia is seen to have a directly related relationship, and thus dependence, to the distribution of mass on the system of interest, in that when there is a larger distribution of mass, there is a larger resistance to movement. Conclusion: Overall, the results demonstrate that the magnitude of the moment of inertia depends on the size of the weight distribution. This is seen in the graph obtained from the experimental moments of inertia calculated and the direct relationship between the angular velocity and the radius of the weights. However, there is a non-negligible y-intercept to consider, showing that there is inertia present even when the radius is zero. This along with other potential random or systemic errors may be present in the results. Such possible random error can stem from the equipment used, the rotational motion sensor, the scales, etc. Probable systematic error may fall under the method in which the measurements were taken or how the three-step pulley was set up that may have increase inaccuracies. During the experiment, there was an effort to mitigate such an error by using the same setup and procedure for each trial and remaining consistent with measuring the slopes of the angular velocity vs. time graphs. Even so, using more accurate measuring devices and consistent push forces is suggested to further minimize possible causes of said systematic error. Further investigation is recommended as well to confirm to deny these findings.
Step by Step Solution
There are 3 Steps involved in it
Step: 1

Get Instant Access to Expert-Tailored Solutions
See step-by-step solutions with expert insights and AI powered tools for academic success
Step: 2

Step: 3
Ace Your Homework with AI
Get the answers you need in no time with our AI-driven, step-by-step assistance
Get Started
Fundamentals of Physics
Authors: Jearl Walker, Halliday Resnick
9th Edition
470469080, 470556536, 470469110, 9780470469088, 9780470556535, 978-0470469118