Answered step by step
Verified Expert Solution
Question
1 Approved Answer
Please read all of the articles and please answer numbers 2 and 3 questions on the assignment selection for Special Education student Scenario Hannah is
Please read all of the articles and please answer numbers 2 and 3 questions on the assignment selection for Special Education student
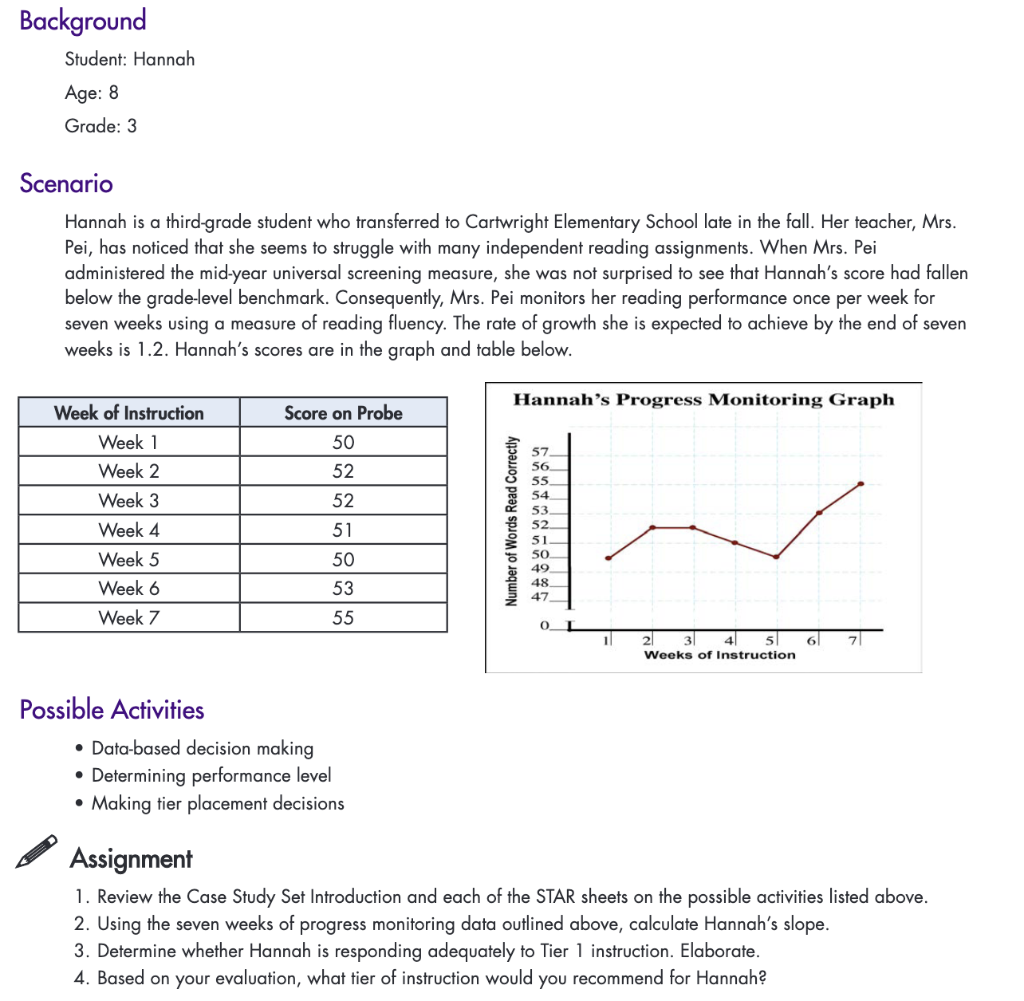
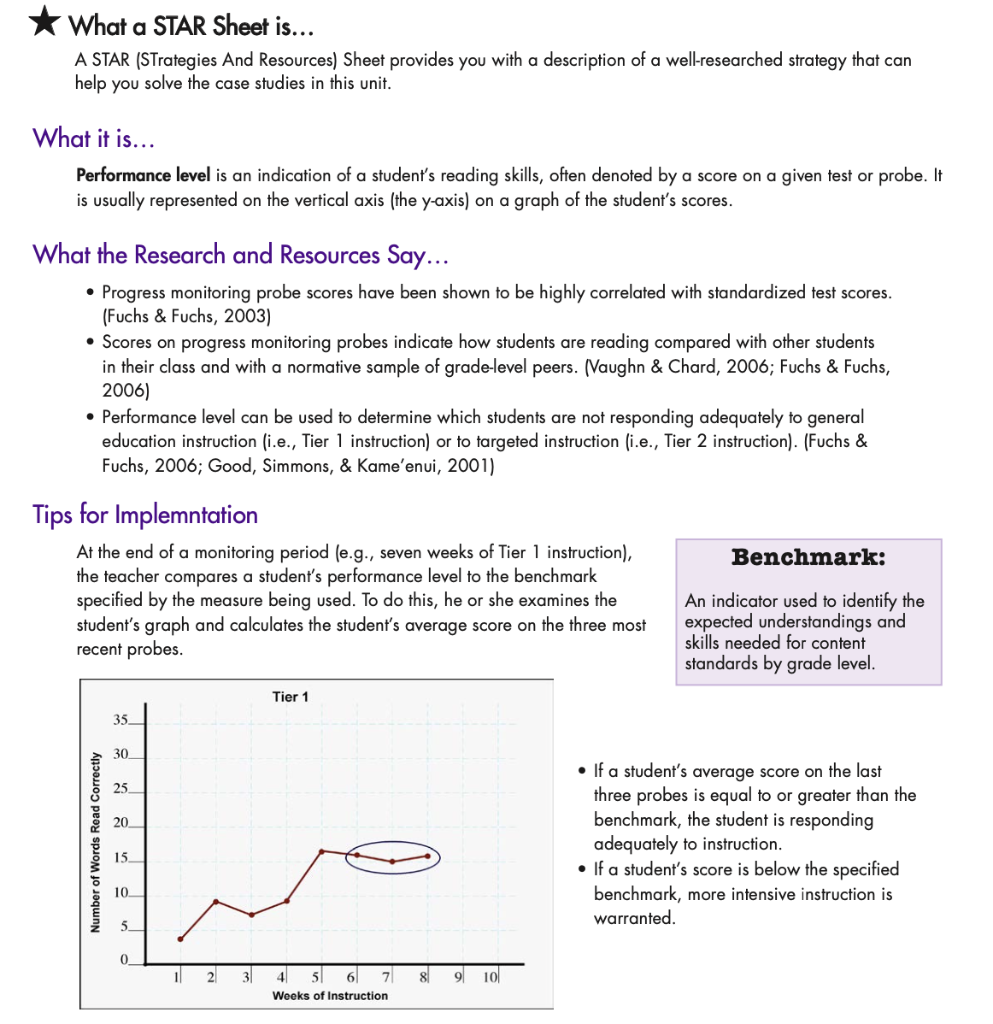
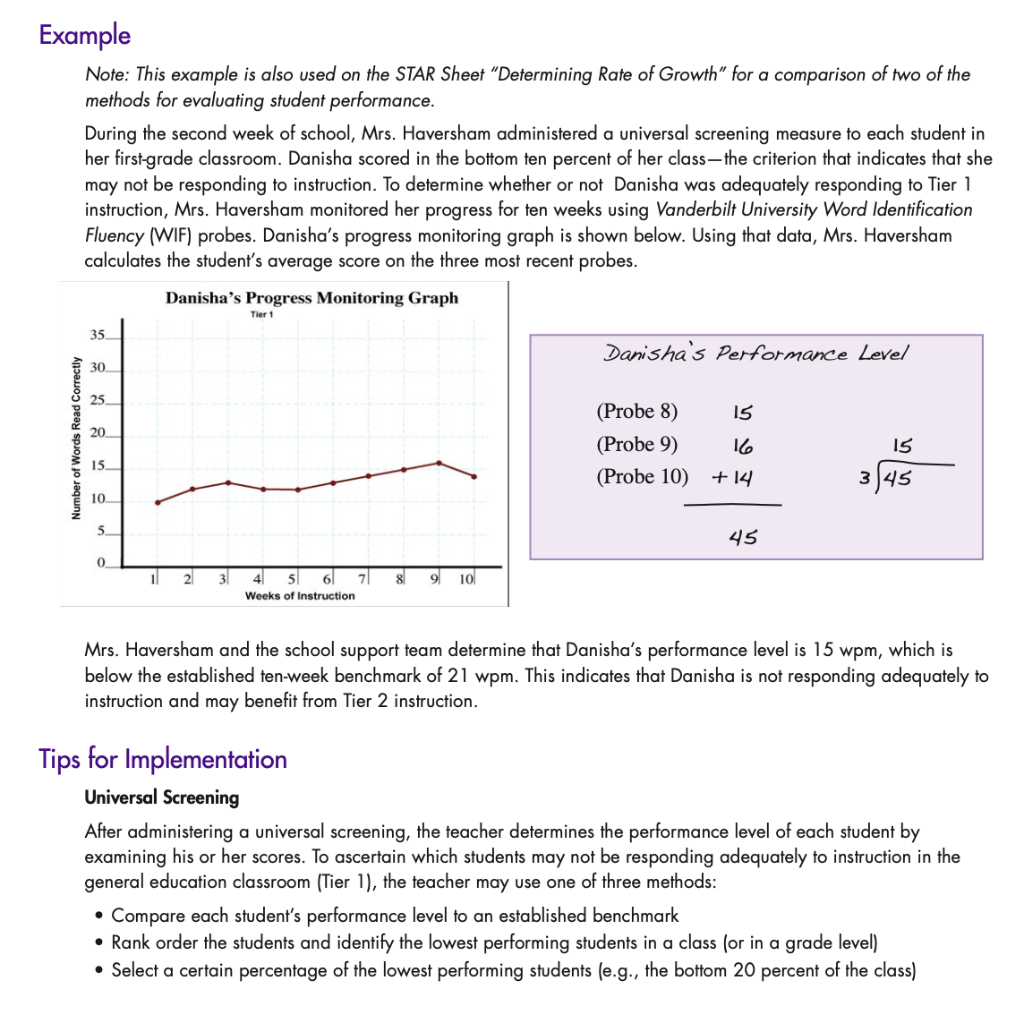
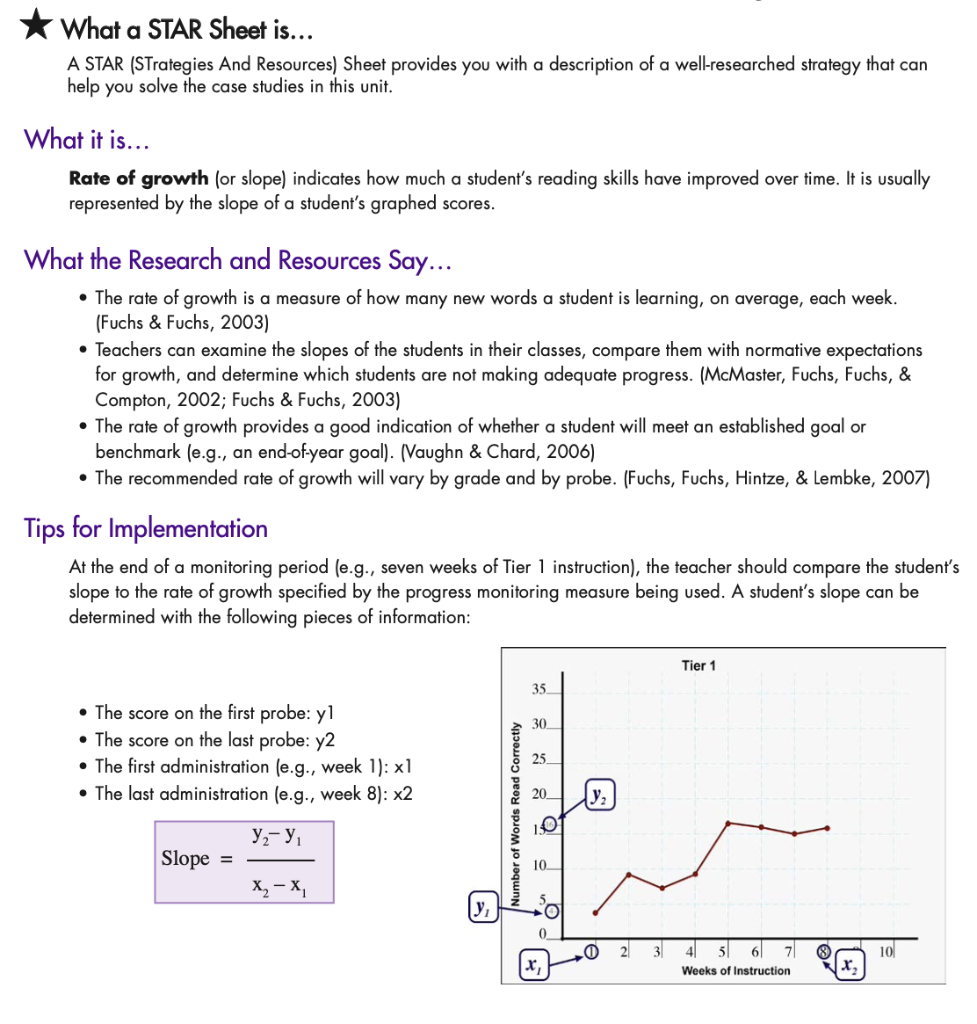
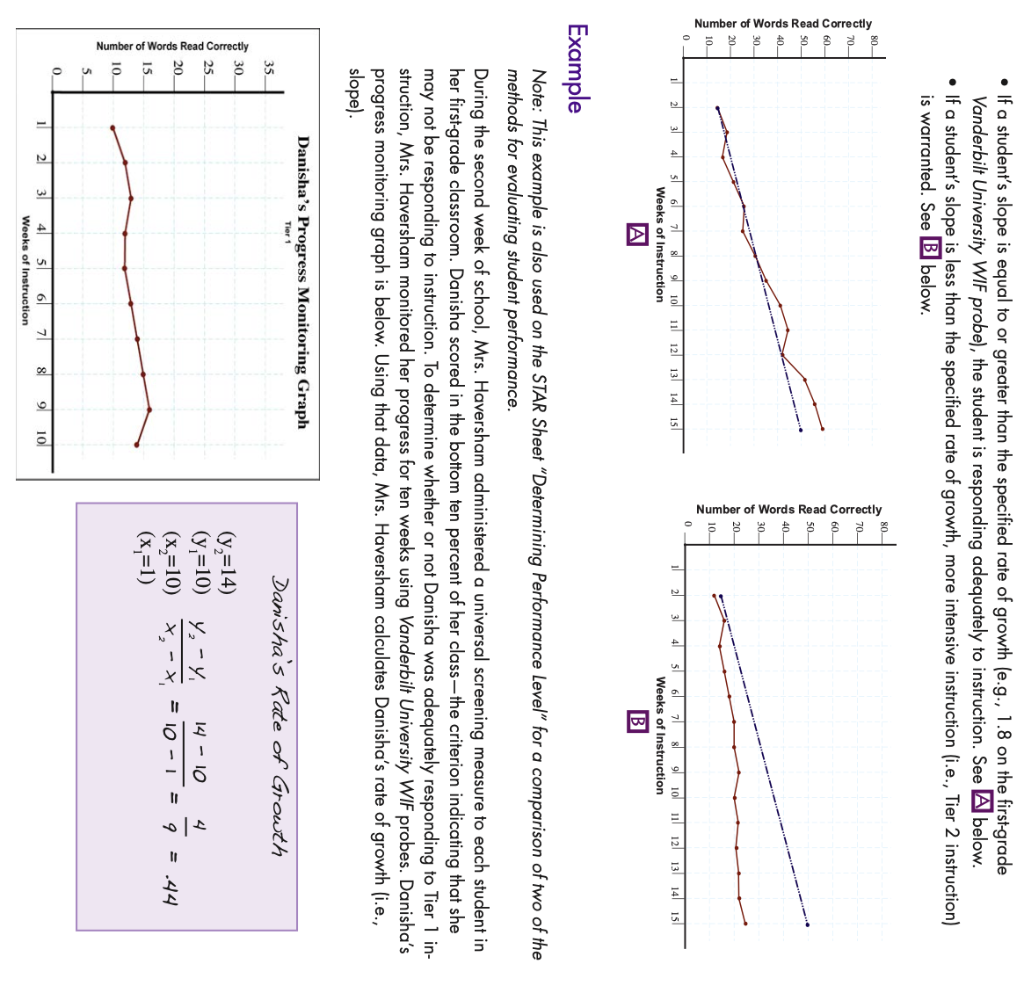
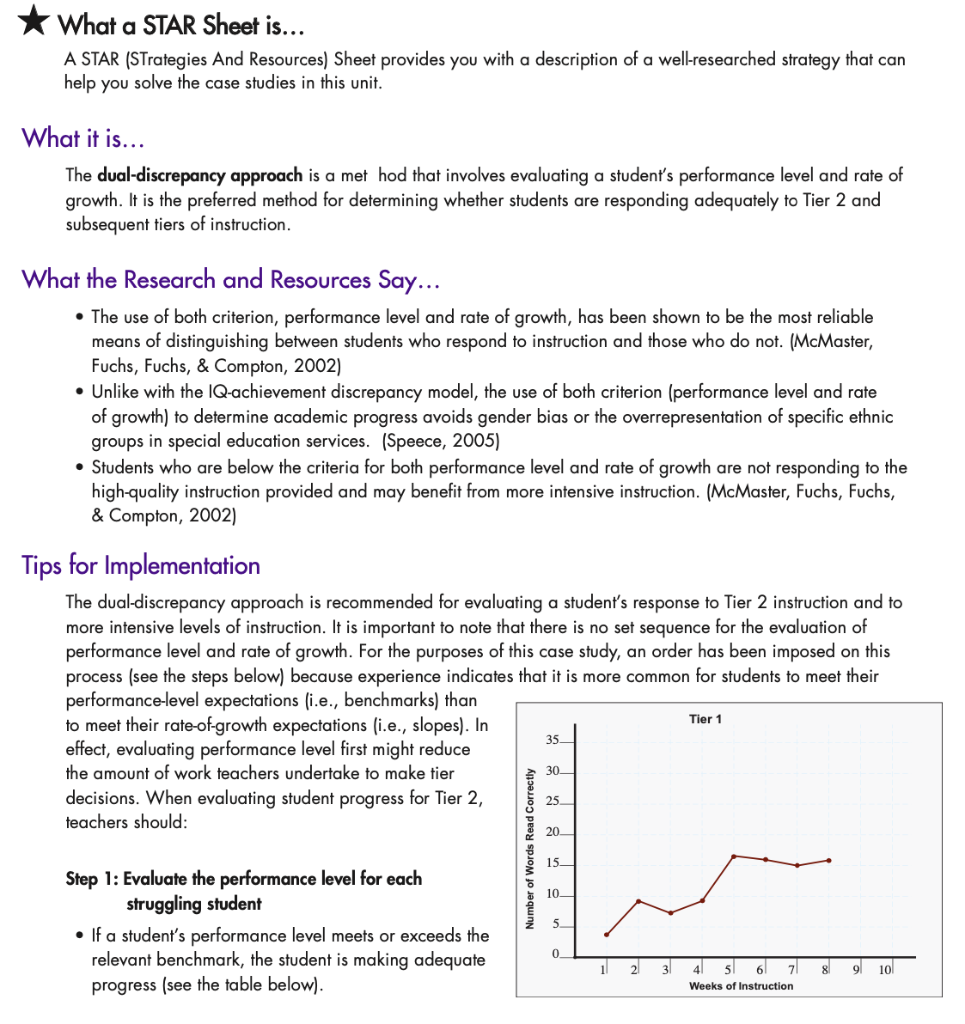
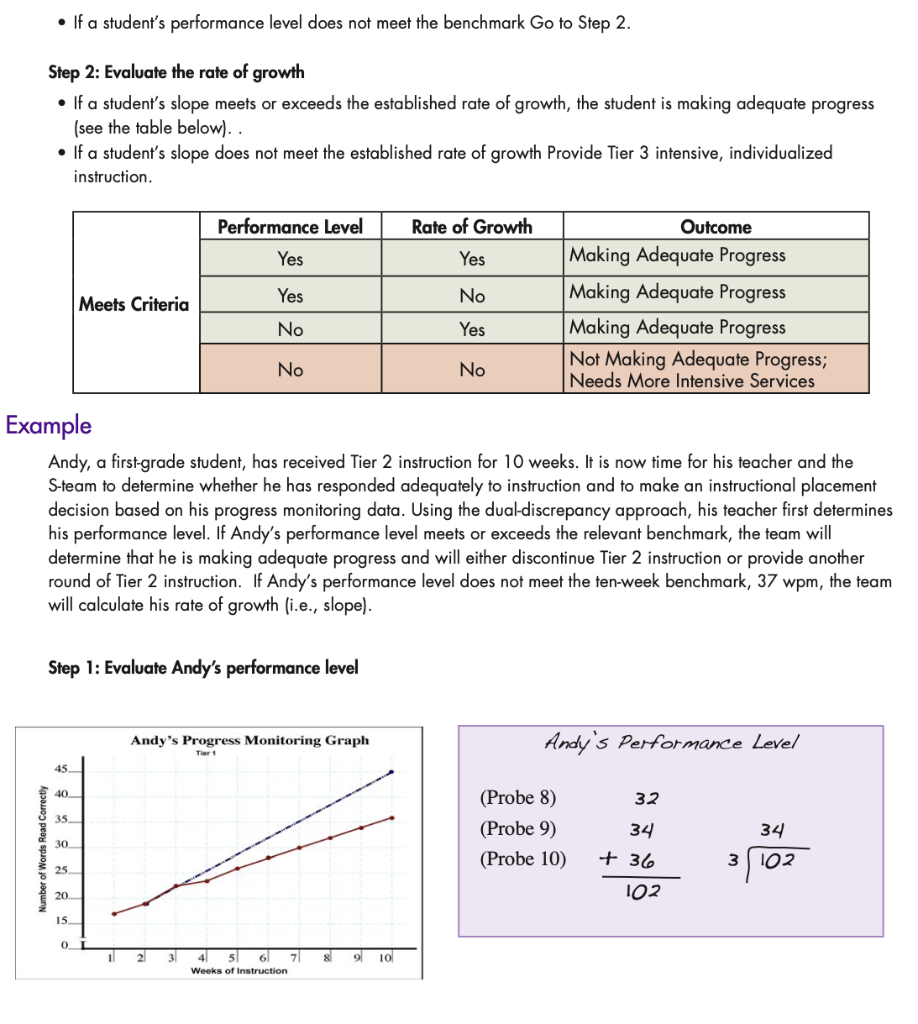
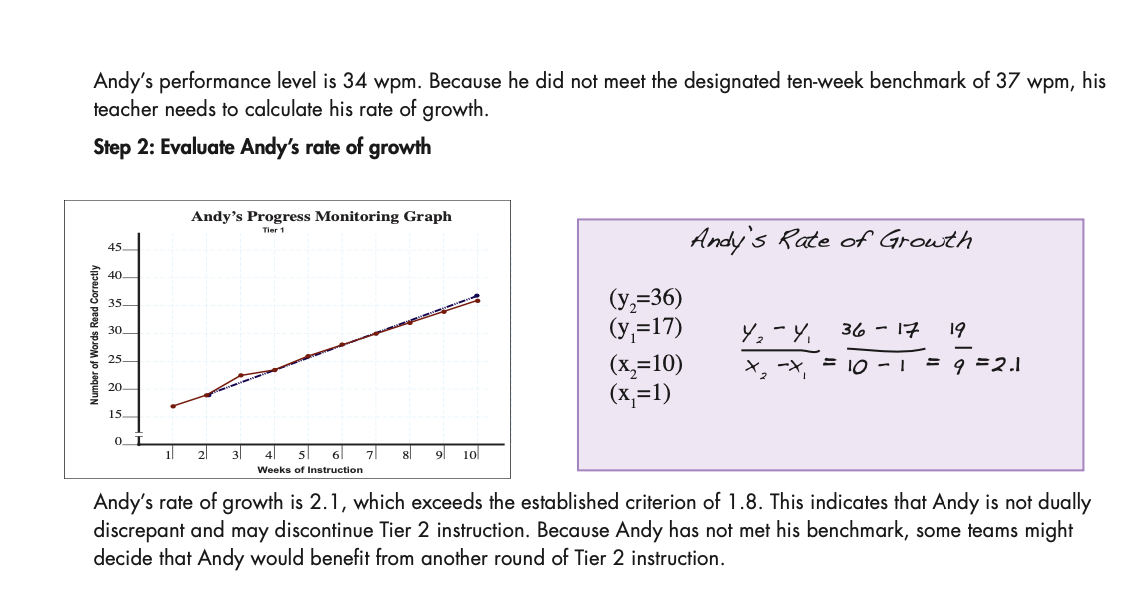
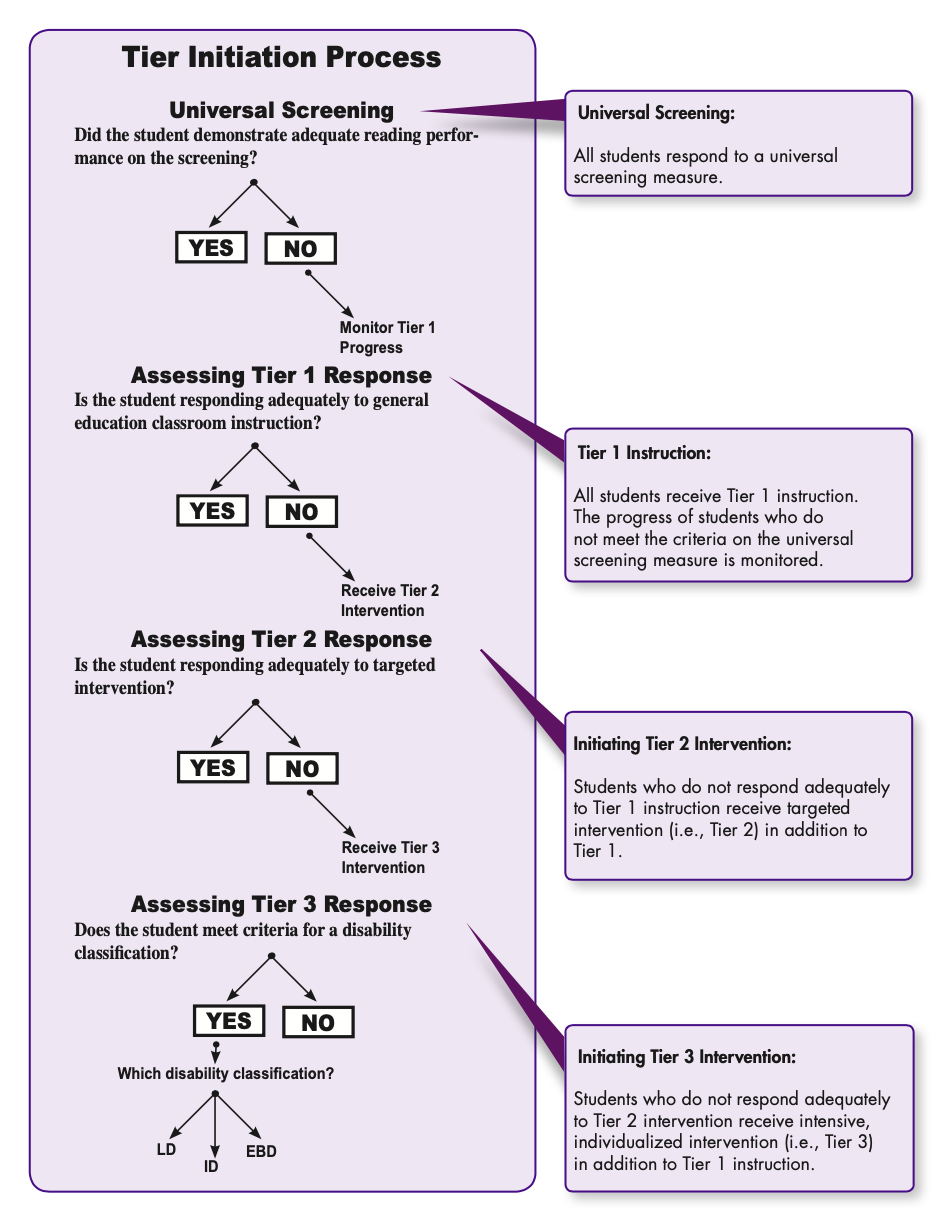
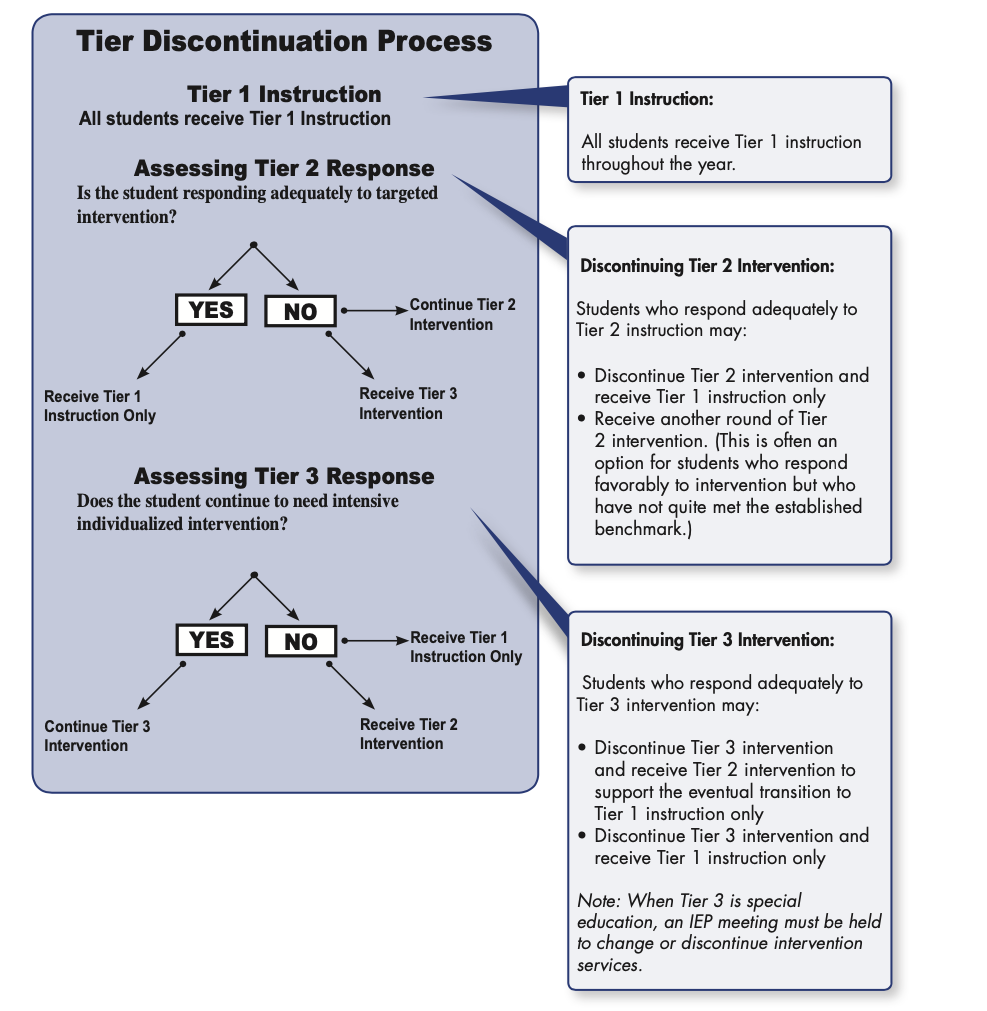
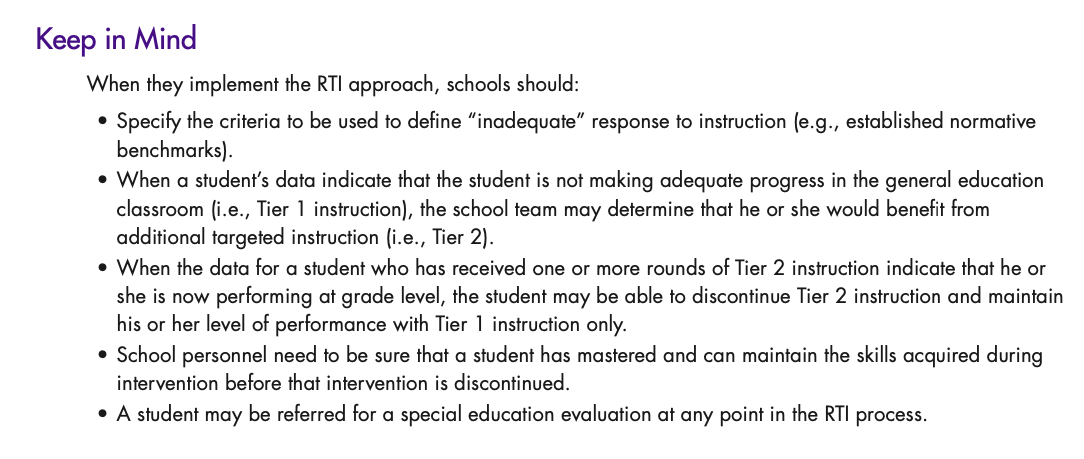
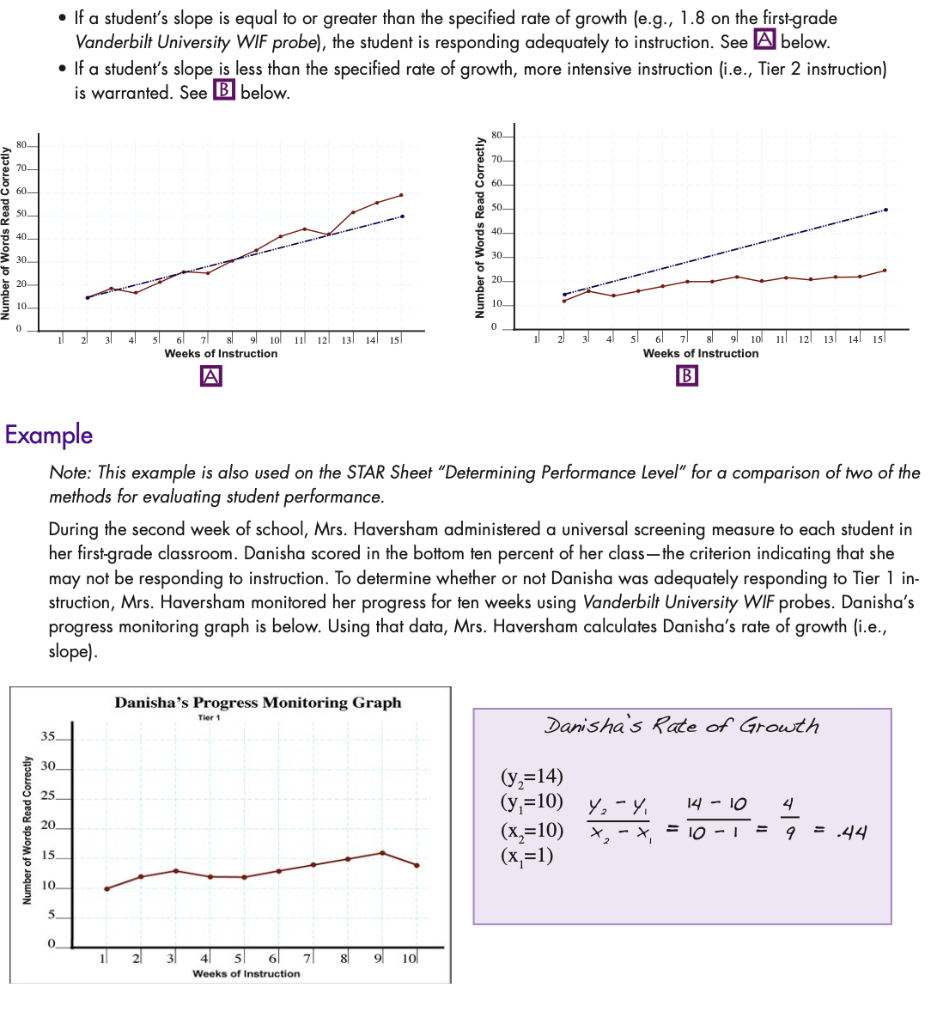
Scenario Hannah is a third-grade student who transferred to Cartwright Elementary School late in the fall. Her teacher, Mrs. Pei, has noticed that she seems to struggle with many independent reading assignments. When Mrs. Pei administered the mid-year universal screening measure, she was not surprised to see that Hannah's score had fallen below the grade-level benchmark. Consequently, Mrs. Pei monitors her reading performance once per week for seven weeks using a measure of reading fluency. The rate of growth she is expected to achieve by the end of seven weeks is 1.2. Hannah's scores are in the graph and table below. Possible Activities - Data-based decision making - Determining performance level - Making tier placement decisions Assignment 1. Review the Case Study Set Introduction and each of the STAR sheets on the possible activities listed above. 2. Using the seven weeks of progress monitoring data outlined above, calculate Hannah's slope. 3. Determine whether Hannah is responding adequately to Tier 1 instruction. Elaborate. 4. Based on your evaluation, what tier of instruction would you recommend for Hannah? What the Research and Resources Say... - Progress monitoring probe scores have been shown to be highly correlated with standardized test scores. (Fuchs \& Fuchs, 2003) - Scores on progress monitoring probes indicate how students are reading compared with other students in their class and with a normative sample of grade-level peers. (Vaughn \& Chard, 2006; Fuchs \& Fuchs, 2006) - Performance level can be used to determine which students are not responding adequately to general education instruction (i.e., Tier 1 instruction) or to targeted instruction (i.e., Tier 2 instruction). (Fuchs \& Fuchs, 2006; Good, Simmons, \& Kame'enui, 2001) Tips for Implemntation At the end of a monitoring period (e.g., seven weeks of Tier 1 instruction), the teacher compares a student's performance level to the benchmark specified by the measure being used. To do this, he or she examines the student's graph and calculates the student's average score on the three most recent probes. An indicator used to identify the expected understandings and skills needed for content standards by grade level. - If a student's average score on the last three probes is equal to or greater than the benchmark, the student is responding adequately to instruction. - If a student's score is below the specified benchmark, more intensive instruction is warranted. xample Note: This example is also used on the STAR Sheet "Determining Rate of Growth" for a comparison of two of the methods for evaluating student performance. During the second week of school, Mrs. Haversham administered a universal screening measure to each student in her first-grade classroom. Danisha scored in the bottom ten percent of her class-the criterion that indicates that she may not be responding to instruction. To determine whether or not Danisha was adequately responding to Tier 1 instruction, Mrs. Haversham monitored her progress for ten weeks using Vanderbilt University Word Identification Fluency (WIF) probes. Danisha's progress monitoring graph is shown below. Using that data, Mrs. Haversham calculates the student's average score on the three most recent probes. Mrs. Haversham and the school support team determine that Danisha's performance level is 15wpm, which is below the established ten-week benchmark of 21 wpm. This indicates that Danisha is not responding adequately to instruction and may benefit from Tier 2 instruction. ips for Implementation Universal Screening After administering a universal screening, the teacher determines the performance level of each student by examining his or her scores. To ascertain which students may not be responding adequately to instruction in the general education classroom (Tier 1), the teacher may use one of three methods: - Compare each student's performance level to an established benchmark - Rank order the students and identify the lowest performing students in a class (or in a grade level) - Select a certain percentage of the lowest performing students (e.g., the bottom 20 percent of the class) X What a STAR Sheet is... A STAR (STrategies And Resources) Sheet provides you with a description of a well-researched strategy that can help you solve the case studies in this unit. What it is... Rate of growth (or slope) indicates how much a student's reading skills have improved over time. It is usually represented by the slope of a student's graphed scores. What the Research and Resources Say... - The rate of growth is a measure of how many new words a student is learning, on average, each week. (Fuchs \& Fuchs, 2003) - Teachers can examine the slopes of the students in their classes, compare them with normative expectations for growth, and determine which students are not making adequate progress. (McMaster, Fuchs, Fuchs, \& Compton, 2002; Fuchs \& Fuchs, 2003) - The rate of growth provides a good indication of whether a student will meet an established goal or benchmark (e.g., an end-of-year goal). (Vaughn \& Chard, 2006) - The recommended rate of growth will vary by grade and by probe. (Fuchs, Fuchs, Hintze, \& Lembke, 2007) Tips for Implementation At the end of a monitoring period (e.g., seven weeks of Tier 1 instruction), the teacher should compare the student's slope to the rate of growth specified by the progress monitoring measure being used. A student's slope can be determined with the following pieces of information: - The score on the first probe: y1 - The score on the last probe: y2 - The first administration (e.g., week 1): x1 - The last administration (e.g., week 8): x2 Slope=x2x1y2y1 - If a student's slope is equal to or greater than the specified rate of growth le.g., 1.8 on the first-grade Vanderbilt University WIF probe), the student is responding adequately to instruction. See A below. - If a student's slope is less than the specified rate of growth, more intensive instruction (i.e., Tier 2 instruction) is warranted. See B below. xample Note: This example is also used on the STAR Sheet "Determining Performance Level" for a comparison of two of the methods for evaluating student performance. During the second week of school, Mrs. Haversham administered a universal screening measure to each student in her first-grade classroom. Danisha scored in the bottom ten percent of her class-the criterion indicating that she may not be responding to instruction. To determine whether or not Danisha was adequately responding to Tier 1 instruction, Mrs. Haversham monitored her progress for ten weeks using Vanderbilt University WIF probes. Danisha's progress monitoring graph is below. Using that data, Mrs. Haversham calculates Danisha's rate of growth (i.e., slope). Danisha's Rate of Growth (y2=14) (y1=10)x2x1y2y1=1011410=94=.44 (x2=10) (x1=1) What a STAR Sheet is... A STAR (STrategies And Resources) Sheet provides you with a description of a well-researched strategy that can help you solve the case studies in this unit. What it is... The dual-discrepancy approach is a met hod that involves evaluating a student's performance level and rate of growth. It is the preferred method for determining whether students are responding adequately to Tier 2 and subsequent tiers of instruction. What the Research and Resources Say... - The use of both criterion, performance level and rate of growth, has been shown to be the most reliable means of distinguishing between students who respond to instruction and those who do not. (McMaster, Fuchs, Fuchs, \& Compton, 2002) - Unlike with the IQ-achievement discrepancy model, the use of both criterion (performance level and rate of growth) to determine academic progress avoids gender bias or the overrepresentation of specific ethnic groups in special education services. (Speece, 2005) - Students who are below the criteria for both performance level and rate of growth are not responding to the high-quality instruction provided and may benefit from more intensive instruction. (McMaster, Fuchs, Fuchs, \& Compton, 2002) Tips for Implementation The dual-discrepancy approach is recommended for evaluating a student's response to Tier 2 instruction and to more intensive levels of instruction. It is important to note that there is no set sequence for the evaluation of performance level and rate of growth. For the purposes of this case study, an order has been imposed on this process (see the steps below) because experience indicates that it is more common for students to meet their performance-level expectations (i.e., benchmarks) than to meet their rate-of-growth expectations (i.e., slopes). In effect, evaluating performance level first might reduce the amount of work teachers undertake to make tier decisions. When evaluating student progress for Tier 2, teachers should: Step 1: Evaluate the performance level for each struggling student - If a student's performance level meets or exceeds the relevant benchmark, the student is making adequate progress (see the table below). - If a student's performance level does not meet the benchmark Go to Step 2. Step 2: Evaluate the rate of growth - If a student's slope meets or exceeds the established rate of growth, the student is making adequate progress (see the table below). . - If a student's slope does not meet the established rate of growth Provide Tier 3 intensive, individualized instruction. cample Andy, a first-grade student, has received Tier 2 instruction for 10 weeks. It is now time for his teacher and the S-team to determine whether he has responded adequately to instruction and to make an instructional placement decision based on his progress monitoring data. Using the dual-discrepancy approach, his teacher first determines his performance level. If Andy's performance level meets or exceeds the relevant benchmark, the team will determine that he is making adequate progress and will either discontinue Tier 2 instruction or provide another round of Tier 2 instruction. If Andy's performance level does not meet the ten-week benchmark, 37 wpm, the team will calculate his rate of growth (i.e., slope). Step 1: Evaluate Andy's performance level Andy's performance level is 34wpm. Because he did not meet the designated ten-week benchmark of 37wpm, his teacher needs to calculate his rate of growth. Step 2: Evaluate Andy's rate of growth Andy's rate of growth is 2.1, which exceeds the established criterion of 1.8. This indicates that Andy is not dually discrepant and may discontinue Tier 2 instruction. Because Andy has not met his benchmark, some teams might decide that Andy would benefit from another round of Tier 2 instruction. Tier Initiation Process Ieceive Ile I msucilum umy Note: When Tier 3 is special education, an IEP meeting must be held to change or discontinue intervention services. Keep in Mind When they implement the RTI approach, schools should: - Specify the criteria to be used to define "inadequate" response to instruction (e.g., established normative benchmarks). - When a student's data indicate that the student is not making adequate progress in the general education classroom (i.e., Tier 1 instruction), the school team may determine that he or she would benefit from additional targeted instruction (i.e., Tier 2). - When the data for a student who has received one or more rounds of Tier 2 instruction indicate that he or she is now performing at grade level, the student may be able to discontinue Tier 2 instruction and maintain his or her level of performance with Tier 1 instruction only. - School personnel need to be sure that a student has mastered and can maintain the skills acquired during intervention before that intervention is discontinued. - A student may be referred for a special education evaluation at any point in the RTI process. - If a student's slope is equal to or greater than the specified rate of growth le.g., 1.8 on the first-grade Vanderbilt University WIF probe), the student is responding adequately to instruction. See A below. - If a student's slope is less than the specified rate of growth, more intensive instruction (i.e., Tier 2 instruction) is warranted. See B below. kample Note: This example is also used on the STAR Sheet "Determining Performance Level" for a comparison of two of the methods for evaluating student performance. During the second week of school, Mrs. Haversham administered a universal screening measure to each student in her first-grade classroom. Danisha scored in the bottom ten percent of her class-the criterion indicating that she may not be responding to instruction. To determine whether or not Danisha was adequately responding to Tier 1 instruction, Mrs. Haversham monitored her progress for ten weeks using Vanderbilt University WIF probes. Danisha's progress monitoring graph is below. Using that data, Mrs. Haversham calculates Danisha's rate of growth (i.e., slope). Danisha's Rate of Growth (y2=14) (y1=10)x2x1y2y1=1011410=94=.44 (x2=10) (x1=1) Scenario Hannah is a third-grade student who transferred to Cartwright Elementary School late in the fall. Her teacher, Mrs. Pei, has noticed that she seems to struggle with many independent reading assignments. When Mrs. Pei administered the mid-year universal screening measure, she was not surprised to see that Hannah's score had fallen below the grade-level benchmark. Consequently, Mrs. Pei monitors her reading performance once per week for seven weeks using a measure of reading fluency. The rate of growth she is expected to achieve by the end of seven weeks is 1.2. Hannah's scores are in the graph and table below. Possible Activities - Data-based decision making - Determining performance level - Making tier placement decisions Assignment 1. Review the Case Study Set Introduction and each of the STAR sheets on the possible activities listed above. 2. Using the seven weeks of progress monitoring data outlined above, calculate Hannah's slope. 3. Determine whether Hannah is responding adequately to Tier 1 instruction. Elaborate. 4. Based on your evaluation, what tier of instruction would you recommend for Hannah? What the Research and Resources Say... - Progress monitoring probe scores have been shown to be highly correlated with standardized test scores. (Fuchs \& Fuchs, 2003) - Scores on progress monitoring probes indicate how students are reading compared with other students in their class and with a normative sample of grade-level peers. (Vaughn \& Chard, 2006; Fuchs \& Fuchs, 2006) - Performance level can be used to determine which students are not responding adequately to general education instruction (i.e., Tier 1 instruction) or to targeted instruction (i.e., Tier 2 instruction). (Fuchs \& Fuchs, 2006; Good, Simmons, \& Kame'enui, 2001) Tips for Implemntation At the end of a monitoring period (e.g., seven weeks of Tier 1 instruction), the teacher compares a student's performance level to the benchmark specified by the measure being used. To do this, he or she examines the student's graph and calculates the student's average score on the three most recent probes. An indicator used to identify the expected understandings and skills needed for content standards by grade level. - If a student's average score on the last three probes is equal to or greater than the benchmark, the student is responding adequately to instruction. - If a student's score is below the specified benchmark, more intensive instruction is warranted. xample Note: This example is also used on the STAR Sheet "Determining Rate of Growth" for a comparison of two of the methods for evaluating student performance. During the second week of school, Mrs. Haversham administered a universal screening measure to each student in her first-grade classroom. Danisha scored in the bottom ten percent of her class-the criterion that indicates that she may not be responding to instruction. To determine whether or not Danisha was adequately responding to Tier 1 instruction, Mrs. Haversham monitored her progress for ten weeks using Vanderbilt University Word Identification Fluency (WIF) probes. Danisha's progress monitoring graph is shown below. Using that data, Mrs. Haversham calculates the student's average score on the three most recent probes. Mrs. Haversham and the school support team determine that Danisha's performance level is 15wpm, which is below the established ten-week benchmark of 21 wpm. This indicates that Danisha is not responding adequately to instruction and may benefit from Tier 2 instruction. ips for Implementation Universal Screening After administering a universal screening, the teacher determines the performance level of each student by examining his or her scores. To ascertain which students may not be responding adequately to instruction in the general education classroom (Tier 1), the teacher may use one of three methods: - Compare each student's performance level to an established benchmark - Rank order the students and identify the lowest performing students in a class (or in a grade level) - Select a certain percentage of the lowest performing students (e.g., the bottom 20 percent of the class) X What a STAR Sheet is... A STAR (STrategies And Resources) Sheet provides you with a description of a well-researched strategy that can help you solve the case studies in this unit. What it is... Rate of growth (or slope) indicates how much a student's reading skills have improved over time. It is usually represented by the slope of a student's graphed scores. What the Research and Resources Say... - The rate of growth is a measure of how many new words a student is learning, on average, each week. (Fuchs \& Fuchs, 2003) - Teachers can examine the slopes of the students in their classes, compare them with normative expectations for growth, and determine which students are not making adequate progress. (McMaster, Fuchs, Fuchs, \& Compton, 2002; Fuchs \& Fuchs, 2003) - The rate of growth provides a good indication of whether a student will meet an established goal or benchmark (e.g., an end-of-year goal). (Vaughn \& Chard, 2006) - The recommended rate of growth will vary by grade and by probe. (Fuchs, Fuchs, Hintze, \& Lembke, 2007) Tips for Implementation At the end of a monitoring period (e.g., seven weeks of Tier 1 instruction), the teacher should compare the student's slope to the rate of growth specified by the progress monitoring measure being used. A student's slope can be determined with the following pieces of information: - The score on the first probe: y1 - The score on the last probe: y2 - The first administration (e.g., week 1): x1 - The last administration (e.g., week 8): x2 Slope=x2x1y2y1 - If a student's slope is equal to or greater than the specified rate of growth le.g., 1.8 on the first-grade Vanderbilt University WIF probe), the student is responding adequately to instruction. See A below. - If a student's slope is less than the specified rate of growth, more intensive instruction (i.e., Tier 2 instruction) is warranted. See B below. xample Note: This example is also used on the STAR Sheet "Determining Performance Level" for a comparison of two of the methods for evaluating student performance. During the second week of school, Mrs. Haversham administered a universal screening measure to each student in her first-grade classroom. Danisha scored in the bottom ten percent of her class-the criterion indicating that she may not be responding to instruction. To determine whether or not Danisha was adequately responding to Tier 1 instruction, Mrs. Haversham monitored her progress for ten weeks using Vanderbilt University WIF probes. Danisha's progress monitoring graph is below. Using that data, Mrs. Haversham calculates Danisha's rate of growth (i.e., slope). Danisha's Rate of Growth (y2=14) (y1=10)x2x1y2y1=1011410=94=.44 (x2=10) (x1=1) What a STAR Sheet is... A STAR (STrategies And Resources) Sheet provides you with a description of a well-researched strategy that can help you solve the case studies in this unit. What it is... The dual-discrepancy approach is a met hod that involves evaluating a student's performance level and rate of growth. It is the preferred method for determining whether students are responding adequately to Tier 2 and subsequent tiers of instruction. What the Research and Resources Say... - The use of both criterion, performance level and rate of growth, has been shown to be the most reliable means of distinguishing between students who respond to instruction and those who do not. (McMaster, Fuchs, Fuchs, \& Compton, 2002) - Unlike with the IQ-achievement discrepancy model, the use of both criterion (performance level and rate of growth) to determine academic progress avoids gender bias or the overrepresentation of specific ethnic groups in special education services. (Speece, 2005) - Students who are below the criteria for both performance level and rate of growth are not responding to the high-quality instruction provided and may benefit from more intensive instruction. (McMaster, Fuchs, Fuchs, \& Compton, 2002) Tips for Implementation The dual-discrepancy approach is recommended for evaluating a student's response to Tier 2 instruction and to more intensive levels of instruction. It is important to note that there is no set sequence for the evaluation of performance level and rate of growth. For the purposes of this case study, an order has been imposed on this process (see the steps below) because experience indicates that it is more common for students to meet their performance-level expectations (i.e., benchmarks) than to meet their rate-of-growth expectations (i.e., slopes). In effect, evaluating performance level first might reduce the amount of work teachers undertake to make tier decisions. When evaluating student progress for Tier 2, teachers should: Step 1: Evaluate the performance level for each struggling student - If a student's performance level meets or exceeds the relevant benchmark, the student is making adequate progress (see the table below). - If a student's performance level does not meet the benchmark Go to Step 2. Step 2: Evaluate the rate of growth - If a student's slope meets or exceeds the established rate of growth, the student is making adequate progress (see the table below). . - If a student's slope does not meet the established rate of growth Provide Tier 3 intensive, individualized instruction. cample Andy, a first-grade student, has received Tier 2 instruction for 10 weeks. It is now time for his teacher and the S-team to determine whether he has responded adequately to instruction and to make an instructional placement decision based on his progress monitoring data. Using the dual-discrepancy approach, his teacher first determines his performance level. If Andy's performance level meets or exceeds the relevant benchmark, the team will determine that he is making adequate progress and will either discontinue Tier 2 instruction or provide another round of Tier 2 instruction. If Andy's performance level does not meet the ten-week benchmark, 37 wpm, the team will calculate his rate of growth (i.e., slope). Step 1: Evaluate Andy's performance level Andy's performance level is 34wpm. Because he did not meet the designated ten-week benchmark of 37wpm, his teacher needs to calculate his rate of growth. Step 2: Evaluate Andy's rate of growth Andy's rate of growth is 2.1, which exceeds the established criterion of 1.8. This indicates that Andy is not dually discrepant and may discontinue Tier 2 instruction. Because Andy has not met his benchmark, some teams might decide that Andy would benefit from another round of Tier 2 instruction. Tier Initiation Process Ieceive Ile I msucilum umy Note: When Tier 3 is special education, an IEP meeting must be held to change or discontinue intervention services. Keep in Mind When they implement the RTI approach, schools should: - Specify the criteria to be used to define "inadequate" response to instruction (e.g., established normative benchmarks). - When a student's data indicate that the student is not making adequate progress in the general education classroom (i.e., Tier 1 instruction), the school team may determine that he or she would benefit from additional targeted instruction (i.e., Tier 2). - When the data for a student who has received one or more rounds of Tier 2 instruction indicate that he or she is now performing at grade level, the student may be able to discontinue Tier 2 instruction and maintain his or her level of performance with Tier 1 instruction only. - School personnel need to be sure that a student has mastered and can maintain the skills acquired during intervention before that intervention is discontinued. - A student may be referred for a special education evaluation at any point in the RTI process. - If a student's slope is equal to or greater than the specified rate of growth le.g., 1.8 on the first-grade Vanderbilt University WIF probe), the student is responding adequately to instruction. See A below. - If a student's slope is less than the specified rate of growth, more intensive instruction (i.e., Tier 2 instruction) is warranted. See B below. kample Note: This example is also used on the STAR Sheet "Determining Performance Level" for a comparison of two of the methods for evaluating student performance. During the second week of school, Mrs. Haversham administered a universal screening measure to each student in her first-grade classroom. Danisha scored in the bottom ten percent of her class-the criterion indicating that she may not be responding to instruction. To determine whether or not Danisha was adequately responding to Tier 1 instruction, Mrs. Haversham monitored her progress for ten weeks using Vanderbilt University WIF probes. Danisha's progress monitoring graph is below. Using that data, Mrs. Haversham calculates Danisha's rate of growth (i.e., slope). Danisha's Rate of Growth (y2=14) (y1=10)x2x1y2y1=1011410=94=.44 (x2=10) (x1=1)
Step by Step Solution
There are 3 Steps involved in it
Step: 1

Get Instant Access to Expert-Tailored Solutions
See step-by-step solutions with expert insights and AI powered tools for academic success
Step: 2

Step: 3

Ace Your Homework with AI
Get the answers you need in no time with our AI-driven, step-by-step assistance
Get Started


